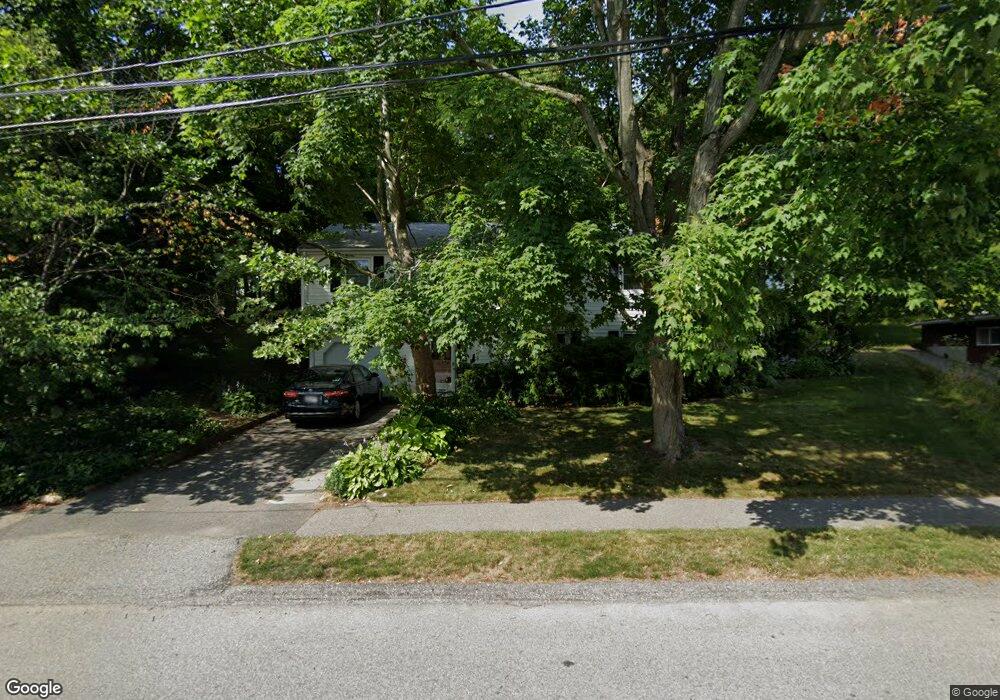
64 Booth St Needham Heights, MA 02494
Estimated Value: $1,081,000 - $1,458,000
3
Beds
3
Baths
1,578
Sq Ft
$801/Sq Ft
Est. Value
About This Home
This home is located at 64 Booth St, Needham Heights, MA 02494 and is currently estimated at $1,263,193, approximately $800 per square foot. 64 Booth St is a home located in Norfolk County with nearby schools including Sunita L. Williams Elementary School, High Rock Middle School, and Pollard Middle School.
Ownership History
Date
Name
Owned For
Owner Type
Purchase Details
Closed on
Feb 11, 2021
Sold by
Susan M Glazer T M and Susan Glazer
Bought by
Glazer Gary J and Glazer Susan M
Current Estimated Value
Purchase Details
Closed on
May 18, 2012
Sold by
Glazer Gary J and Glazer Susan M
Bought by
Susan M Glazer 1997 T M and Susan Glazer
Create a Home Valuation Report for This Property
The Home Valuation Report is an in-depth analysis detailing your home's value as well as a comparison with similar homes in the area
Home Values in the Area
Average Home Value in this Area
Purchase History
| Date | Buyer | Sale Price | Title Company |
|---|---|---|---|
| Glazer Gary J | -- | None Available | |
| Glazer Gary J | -- | None Available | |
| Susan M Glazer 1997 T M | -- | -- | |
| Susan M Glazer 1997 T | -- | -- |
Source: Public Records
Mortgage History
| Date | Status | Borrower | Loan Amount |
|---|---|---|---|
| Previous Owner | Susan M Glazer 1997 T M | $228,000 |
Source: Public Records
Tax History Compared to Growth
Tax History
| Year | Tax Paid | Tax Assessment Tax Assessment Total Assessment is a certain percentage of the fair market value that is determined by local assessors to be the total taxable value of land and additions on the property. | Land | Improvement |
|---|---|---|---|---|
| 2025 | $11,320 | $1,067,900 | $767,800 | $300,100 |
| 2024 | $10,101 | $806,800 | $496,700 | $310,100 |
| 2023 | $10,199 | $782,100 | $496,700 | $285,400 |
| 2022 | $9,681 | $724,100 | $445,200 | $278,900 |
| 2021 | $9,370 | $719,100 | $445,200 | $273,900 |
| 2020 | $9,159 | $733,300 | $445,200 | $288,100 |
| 2019 | $8,570 | $691,700 | $406,200 | $285,500 |
| 2018 | $8,217 | $691,700 | $406,200 | $285,500 |
| 2017 | $7,805 | $656,400 | $406,200 | $250,200 |
| 2016 | $7,444 | $645,100 | $406,200 | $238,900 |
| 2015 | $7,283 | $645,100 | $406,200 | $238,900 |
| 2014 | $6,684 | $574,200 | $341,200 | $233,000 |
Source: Public Records
Map
Nearby Homes
- 70 Booth St
- 263 Hunnewell St
- 35 Andrea Cir
- 443 Central Ave
- 48 Taylor St
- 7 Avery St
- 381 Hunnewell St Unit 381
- 379 Hunnewell St Unit 379
- 14 Hunnewell St
- 132 Hillside Ave
- 403 Hunnewell St Unit 403
- 400 Hunnewell St Unit 103
- 78 Hunnewell St
- 208 Webster St
- 310 Oakland St
- 760 Highland Ave Unit 2
- 71 Brookside Rd
- 445 Hillside Ave
- 28 Mercer Rd
- 36 Davenport Rd