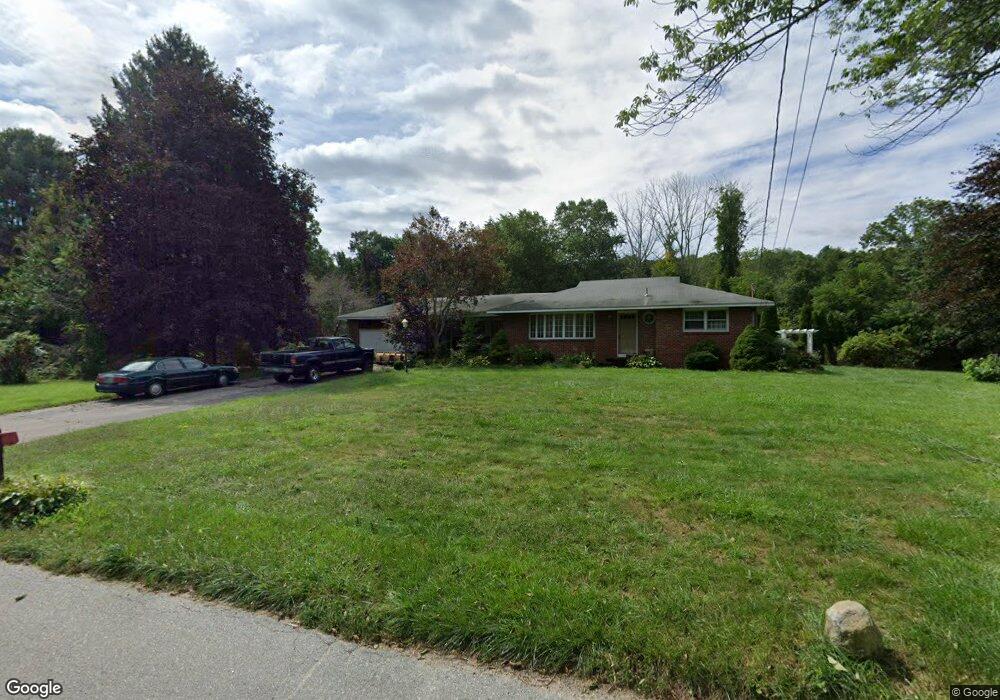
64 Burnt Swamp Rd Cumberland, RI 02864
North Cumberland NeighborhoodEstimated Value: $720,434 - $866,000
About This Home
This home is located at 64 Burnt Swamp Rd, Cumberland, RI 02864 and is currently estimated at $795,359, approximately $333 per square foot. 64 Burnt Swamp Rd is a home located in Providence County with nearby schools including Community School, North Cumberland Middle School, and Cumberland High School.
Ownership History
We collect this data history from publicly available records. To have your information removed, we recommend requesting removal directly through your county’s website.
Purchase Details
Purchase Details
Home Values in the Area
Average Home Value in this Area
Purchase History
We collect this data history from publicly available records. To have your information removed, we recommend requesting removal directly through your county’s website.
| Date | Buyer | Sale Price | Title Company |
|---|---|---|---|
| -- | None Available | ||
| -- | -- |
Mortgage History
We collect this data history from publicly available records. To have your information removed, we recommend requesting removal directly through your county’s website.
| Date | Status | Borrower | Loan Amount |
|---|---|---|---|
| Previous Owner | $274,945 | ||
| Previous Owner | $100,000 | ||
| Previous Owner | $309,000 |
Tax History
We collect this data history from publicly available records. To have your information removed, we recommend requesting removal directly through your county’s website.
| Year | Tax Paid | Tax Assessment Tax Assessment Total Assessment is a certain percentage of the fair market value that is determined by local assessors to be the total taxable value of land and additions on the property. | Land | Improvement |
|---|---|---|---|---|
| 2025 | $6,702 | $546,200 | $225,000 | $321,200 |
| 2024 | $6,527 | $546,200 | $225,000 | $321,200 |
| 2023 | $6,347 | $546,200 | $225,000 | $321,200 |
| 2022 | $6,141 | $409,700 | $162,100 | $247,600 |
| 2021 | $6,039 | $409,700 | $162,100 | $247,600 |
| 2020 | $5,867 | $409,700 | $162,100 | $247,600 |
| 2019 | $5,712 | $359,700 | $149,300 | $210,400 |
| 2018 | $5,547 | $359,700 | $149,300 | $210,400 |
| 2017 | $5,471 | $359,700 | $149,300 | $210,400 |
| 2016 | $5,334 | $312,300 | $141,700 | $170,600 |
| 2015 | $5,334 | $312,300 | $141,700 | $170,600 |
| 2014 | $4,638 | $312,300 | $141,700 | $170,600 |
| 2013 | $4,682 | $296,700 | $144,600 | $152,100 |
Map
- 65 Rhodes St
- 64 Warren St
- 20 Peggy Dr
- 14 Amber Dr
- 376 Hancock St
- 3980 Diamond Hill Rd Unit 4
- 5 Hannah Dr
- 5 Chestnut St
- 42 Georgiana Dr
- 14 Metcalf Dr
- 710 Nate Whipple Hwy
- 711 Nate Whipple Hwy
- 18 Manchester Dr
- 4 Lynn Ave
- 167 Sun Valley Dr
- 9 Fletcher St
- 108 Bayberry Rd
- 4A Fletcher St
- 3360 Diamond Hill Rd
- 96 Sleepy Hollow Dr
Ask me questions while you tour the home.