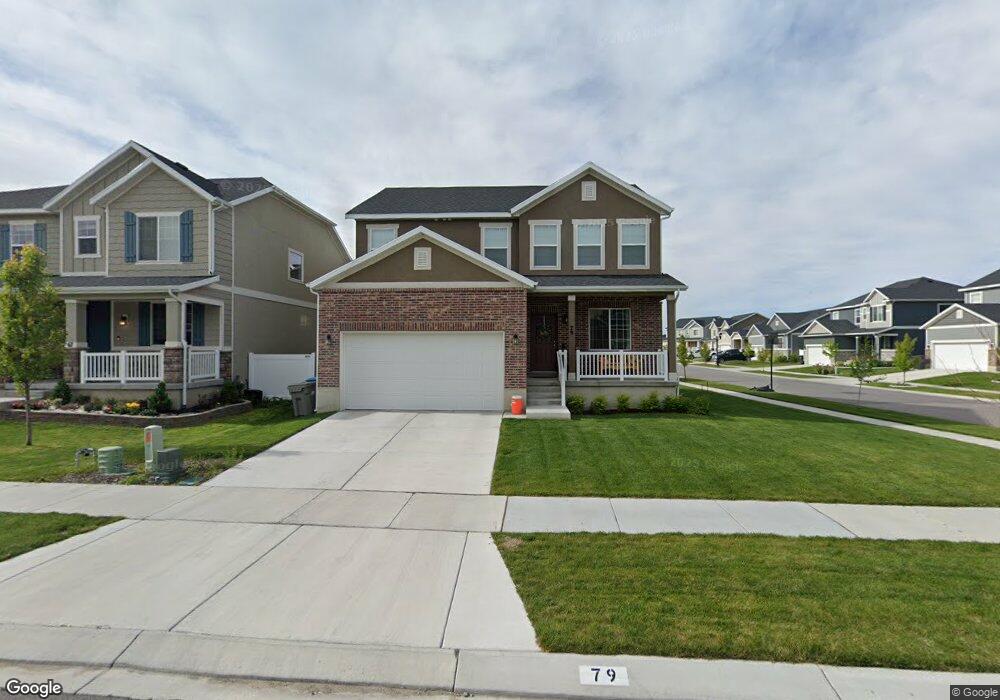
64 Canyon Maple Rd Vineyard, UT 84058
Estimated Value: $617,000 - $664,000
6
Beds
3
Baths
3,036
Sq Ft
$210/Sq Ft
Est. Value
About This Home
This home is located at 64 Canyon Maple Rd, Vineyard, UT 84058 and is currently estimated at $636,386, approximately $209 per square foot. 64 Canyon Maple Rd is a home located in Utah County with nearby schools including Orem Junior High School, Mountain View High School, and Freedom Preparatory Academy - Vineyard.
Ownership History
Date
Name
Owned For
Owner Type
Purchase Details
Closed on
Sep 17, 2021
Sold by
Hunsaker Brandon
Bought by
Kmbk Real Estate Llc
Current Estimated Value
Purchase Details
Closed on
Jan 23, 2019
Sold by
Haslam J Kevan and Haslam Brook
Bought by
Hunsaker Brandon
Home Financials for this Owner
Home Financials are based on the most recent Mortgage that was taken out on this home.
Original Mortgage
$339,500
Interest Rate
4.6%
Mortgage Type
New Conventional
Purchase Details
Closed on
Feb 27, 2017
Sold by
Richmond American Homes Of Utah Inc
Bought by
Haslam Kevin J and Haslam Brook
Home Financials for this Owner
Home Financials are based on the most recent Mortgage that was taken out on this home.
Original Mortgage
$278,410
Interest Rate
3.75%
Mortgage Type
FHA
Create a Home Valuation Report for This Property
The Home Valuation Report is an in-depth analysis detailing your home's value as well as a comparison with similar homes in the area
Home Values in the Area
Average Home Value in this Area
Purchase History
| Date | Buyer | Sale Price | Title Company |
|---|---|---|---|
| Kmbk Real Estate Llc | -- | Gt Title Services | |
| Hunsaker Brandon | -- | First American Title Ins Co | |
| Haslam Kevin J | -- | First American Title |
Source: Public Records
Mortgage History
| Date | Status | Borrower | Loan Amount |
|---|---|---|---|
| Previous Owner | Hunsaker Brandon | $339,500 | |
| Previous Owner | Haslam Kevin J | $278,410 |
Source: Public Records
Tax History
| Year | Tax Paid | Tax Assessment Tax Assessment Total Assessment is a certain percentage of the fair market value that is determined by local assessors to be the total taxable value of land and additions on the property. | Land | Improvement |
|---|---|---|---|---|
| 2025 | $3,271 | $332,530 | -- | -- |
| 2024 | $3,271 | $306,845 | $0 | $0 |
| 2023 | $2,947 | $308,825 | $0 | $0 |
| 2022 | $3,032 | $308,935 | $0 | $0 |
| 2021 | $2,456 | $383,700 | $157,400 | $226,300 |
| 2020 | $2,298 | $358,600 | $143,100 | $215,500 |
| 2019 | $2,086 | $335,400 | $133,500 | $201,900 |
| 2018 | $2,005 | $296,400 | $120,800 | $175,600 |
| 2017 | $1,265 | $100,760 | $0 | $0 |
| 2016 | $1,123 | $89,000 | $0 | $0 |
| 2015 | $502 | $89,000 | $0 | $0 |
Source: Public Records
Map
Nearby Homes
- 35 E Water Ln
- 7 E Sterling Loop
- 153 W Hackberry Rd
- 209 W Hackberry Rd Unit 6523
- 124 S Dry Creek Ln
- 323 N 20 W
- 149 E 230 N
- 20 W Stillwater S Unit 151
- 224 S Dry Creek Ln
- 68 E Zinfandel Ln
- 272 S Sunset Dr Unit 53
- 64 W 470 N
- 71 E Powell St Unit 106
- 344 S Tahoe St
- 338 W 460 N
- 353 W 490 N
- 441 S Main St Unit 135
- 422 E 360 North St
- 1057 W Seasons Dr
- 235 N 590 E
- 54 Canyon Maple Rd
- 76 Canyon Maple Rd
- 69 Chalk Maple Ln Unit 4045
- 57 Chalk Maple Ln
- 77 N Chalk Maple Ln
- 44 N Canyon Maple Rd
- 75 N Canyon Maple Rd
- 79 Birds Eye Ln Unit 4049
- 79 Birds Eye Ln
- 45 N Chalk Maple Ln
- 67 W Birds Eye Ln
- 63 Canyon Maple Rd Unit 4060
- 53 N Canyon Maple Rd
- 53 Birds Eye Ln Unit 4047
- 87 N Canyon Maple Rd
- 43 Canyon Maple Rd Unit 4058
- 66 Chalk Maple Ln
- 72 Chalk Maple Ln Unit 4036
- 62 N Trident Maple Dr
- 54 N Chalk Maple Ln
Your Personal Tour Guide
Ask me questions while you tour the home.