J
Landlord's Agent in 2025
John Gould
Compass
8 Total Sales

Estimated Value: $431,000 - $488,224
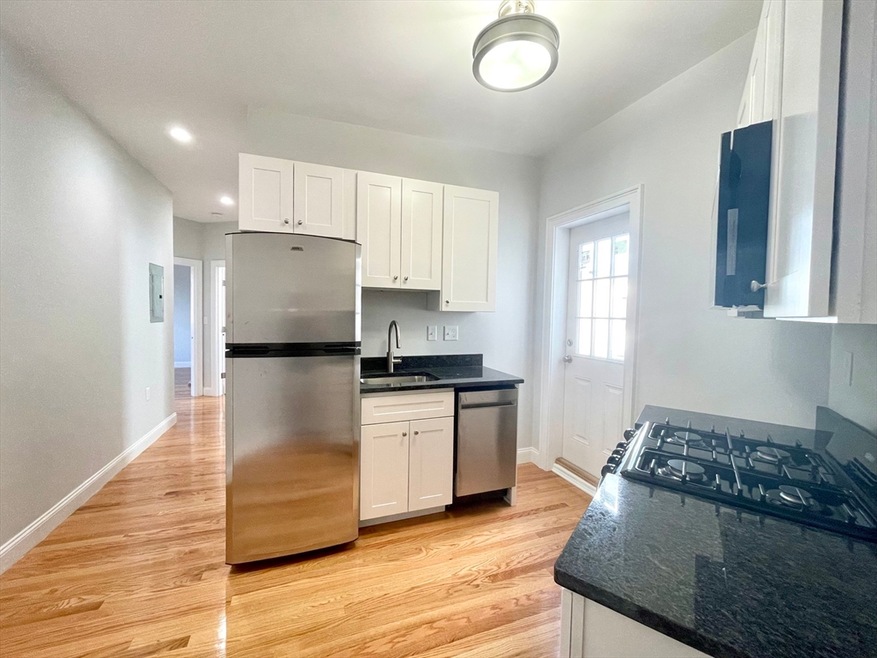
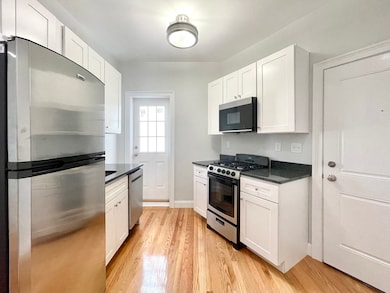
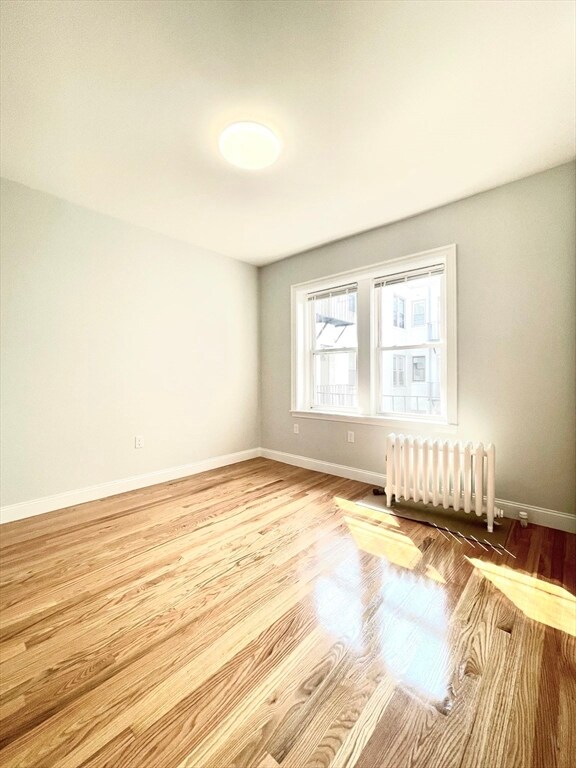
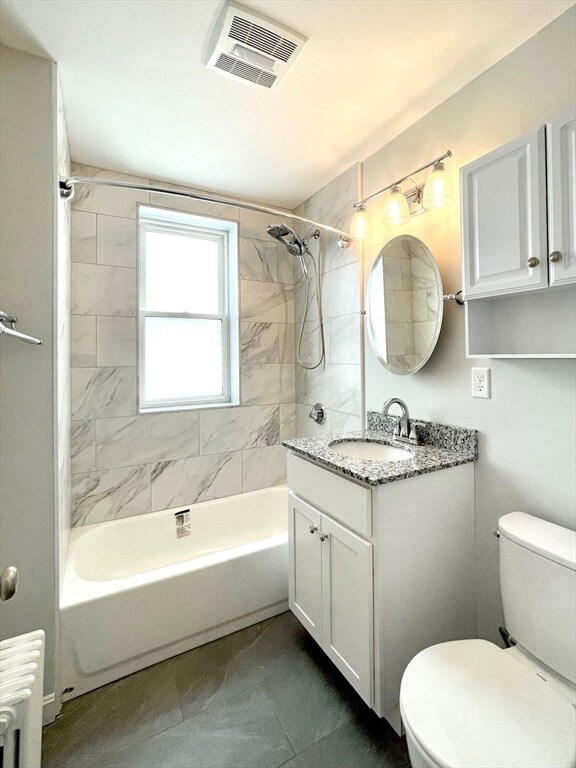
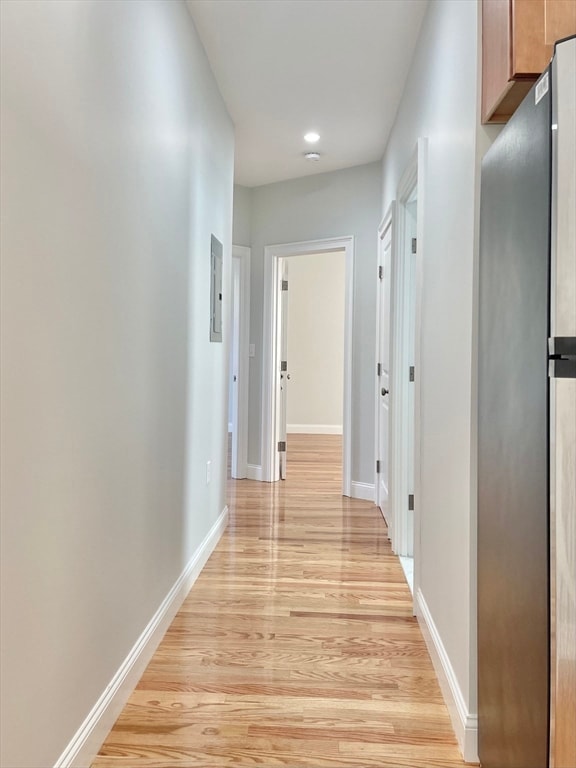
Fully renovated 1 bed, 1 bath apartment in prime Back Bay location. New 2021 hardwood floors, 2021 kitchen appliances and renovation, 2021 bathroom renovation, and freshly painted throughout. Excellent layout, large closets, and abundant natural light. Close proximity to Newbury St, Boylston St, and Fenway shopping and restaurants. Heat and hot water included. No pets. Available Now.Lease length can be either now through 8/31/2025 or 8/31/2026.Rent includes heat and hot water. Renters insurance required. No open flames other than gas stove. No pets. First, last, security, and broker fee up front.
| Date | Buyer | Sale Price | Title Company |
|---|---|---|---|
| Irving Jason C | $239,000 | -- |
| Date | Status | Borrower | Loan Amount |
|---|---|---|---|
| Open | Irving Jason C | $191,200 |
| Date | Event | Price | List to Sale | Price per Sq Ft |
|---|---|---|---|---|
| 03/01/2025 03/01/25 | Rented | $2,700 | 0.0% | -- |
| 02/20/2025 02/20/25 | For Rent | $2,700 | 0.0% | -- |
| 10/19/2021 10/19/21 | Rented | -- | -- | -- |
| 10/13/2021 10/13/21 | Under Contract | -- | -- | -- |
| 09/09/2021 09/09/21 | For Rent | $2,700 | -- | -- |
| Year | Tax Paid | Tax Assessment Tax Assessment Total Assessment is a certain percentage of the fair market value that is determined by local assessors to be the total taxable value of land and additions on the property. | Land | Improvement |
|---|---|---|---|---|
| 2025 | $5,250 | $453,400 | $0 | $453,400 |
| 2024 | $4,909 | $450,400 | $0 | $450,400 |
| 2023 | $4,693 | $437,000 | $0 | $437,000 |
| 2022 | $4,433 | $407,400 | $0 | $407,400 |
| 2021 | $4,262 | $399,400 | $0 | $399,400 |
| 2020 | $3,996 | $378,400 | $0 | $378,400 |
| 2019 | $3,728 | $353,700 | $0 | $353,700 |
| 2018 | $3,433 | $327,600 | $0 | $327,600 |
| 2017 | $3,303 | $311,900 | $0 | $311,900 |
| 2016 | $3,267 | $297,000 | $0 | $297,000 |
| 2015 | $2,822 | $233,000 | $0 | $233,000 |
| 2014 | $2,939 | $233,600 | $0 | $233,600 |
J
Landlord's Agent in 2025
John Gould
Compass
8 Total Sales

Tenant's Agent in 2025
Alyssa Mazur
Compass
(781) 786-1163
20 Total Sales
K
Buyer's Agent in 2021
KR Boston
Keller Williams Realty Boston Northwest
9 Total Sales
Source: MLS Property Information Network (MLS PIN)
MLS Number: 73336853
APN: CBOS-000000-000005-004165-000186
Disclaimer: Certain information contained herein is derived from information provided by parties other than Homes.com. All information provided is deemed reliable, but is not guaranteed to be accurate and should be independently verified.
![]() The property listing data and information, or the Images, set forth herein were provided to MLS Property Information Network, Inc. from third party sources, including sellers, lessors and public records, and were compiled by MLS Property Information Network, Inc. The property listing data and information, and the Images, are for the personal, non-commercial use of consumers having a good faith interest in purchasing or leasing listed properties of the type displayed to them and may not be used for any purpose other than to identify prospective properties which such consumers may have a good faith interest in purchasing or leasing. MLS Property Information Network, Inc. and its subscribers disclaim any and all representations and warranties as to the accuracy of the property listing data and information, or as to the accuracy of any of the Images, set forth herein.
The property listing data and information, or the Images, set forth herein were provided to MLS Property Information Network, Inc. from third party sources, including sellers, lessors and public records, and were compiled by MLS Property Information Network, Inc. The property listing data and information, and the Images, are for the personal, non-commercial use of consumers having a good faith interest in purchasing or leasing listed properties of the type displayed to them and may not be used for any purpose other than to identify prospective properties which such consumers may have a good faith interest in purchasing or leasing. MLS Property Information Network, Inc. and its subscribers disclaim any and all representations and warranties as to the accuracy of the property listing data and information, or as to the accuracy of any of the Images, set forth herein.
Ask me questions while you tour the home.