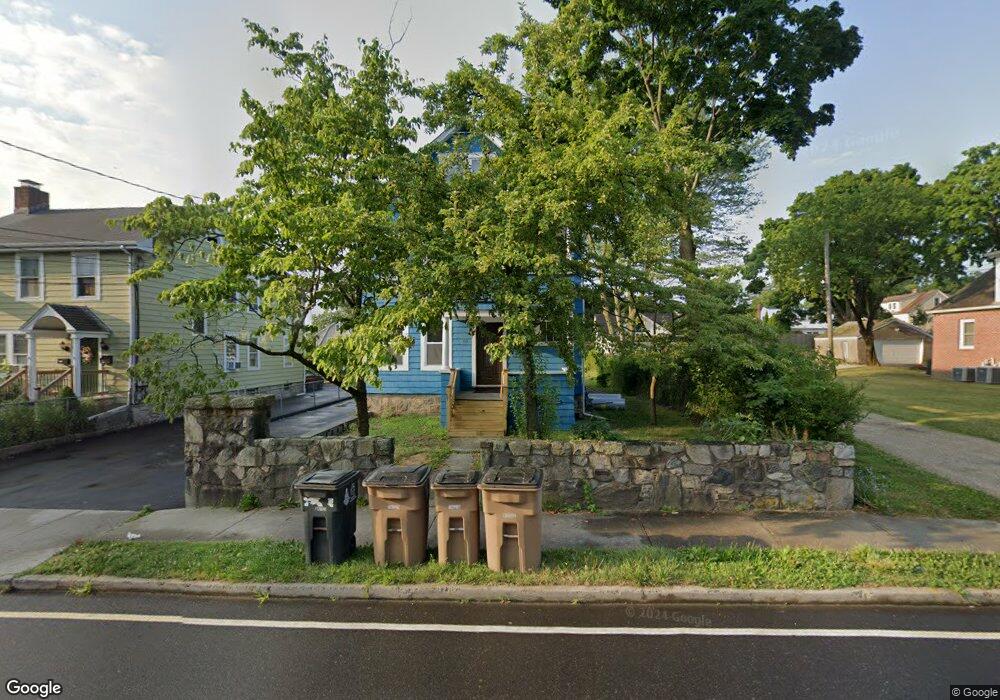
64 Colonial Rd Unit 3 Stamford, CT 06906
Glenbrook NeighborhoodEstimated Value: $869,000 - $1,024,000
5
Beds
1
Bath
480
Sq Ft
$1,913/Sq Ft
Est. Value
About This Home
This home is located at 64 Colonial Rd Unit 3, Stamford, CT 06906 and is currently estimated at $918,212, approximately $1,912 per square foot. 64 Colonial Rd Unit 3 is a home located in Fairfield County with nearby schools including Julia A. Stark Elementary School, Dolan School, and Stamford High School.
Ownership History
Date
Name
Owned For
Owner Type
Purchase Details
Closed on
Oct 24, 2024
Sold by
Ahmed Mustak
Bought by
Zheng Meng Y and Huang Mei Z
Current Estimated Value
Home Financials for this Owner
Home Financials are based on the most recent Mortgage that was taken out on this home.
Original Mortgage
$618,750
Outstanding Balance
$612,058
Interest Rate
6.2%
Mortgage Type
Purchase Money Mortgage
Estimated Equity
$306,154
Purchase Details
Closed on
Aug 28, 2023
Sold by
Tsihlis Louis
Bought by
Ahmed Mustak
Purchase Details
Closed on
Jul 1, 1977
Bought by
Tsihlis Louis
Create a Home Valuation Report for This Property
The Home Valuation Report is an in-depth analysis detailing your home's value as well as a comparison with similar homes in the area
Home Values in the Area
Average Home Value in this Area
Purchase History
| Date | Buyer | Sale Price | Title Company |
|---|---|---|---|
| Zheng Meng Y | $825,000 | None Available | |
| Zheng Meng Y | $825,000 | None Available | |
| Zheng Meng Y | $825,000 | None Available | |
| Ahmed Mustak | $605,000 | None Available | |
| Ahmed Mustak | $605,000 | None Available | |
| Ahmed Mustak | $605,000 | None Available | |
| Ahmed Mustak | $605,000 | None Available | |
| Ahmed Mustak | $605,000 | None Available | |
| Ahmed Mustak | $605,000 | None Available | |
| Tsihlis Louis | -- | -- |
Source: Public Records
Mortgage History
| Date | Status | Borrower | Loan Amount |
|---|---|---|---|
| Open | Zheng Meng Y | $618,750 | |
| Closed | Zheng Meng Y | $618,750 |
Source: Public Records
Tax History Compared to Growth
Tax History
| Year | Tax Paid | Tax Assessment Tax Assessment Total Assessment is a certain percentage of the fair market value that is determined by local assessors to be the total taxable value of land and additions on the property. | Land | Improvement |
|---|---|---|---|---|
| 2025 | $10,565 | $441,700 | $205,810 | $235,890 |
| 2024 | $10,318 | $441,700 | $205,810 | $235,890 |
| 2023 | $11,149 | $441,700 | $205,810 | $235,890 |
| 2022 | $9,155 | $336,940 | $157,980 | $178,960 |
| 2021 | $9,077 | $336,940 | $157,980 | $178,960 |
| 2020 | $8,878 | $336,940 | $157,980 | $178,960 |
| 2019 | $8,878 | $336,940 | $157,980 | $178,960 |
| 2018 | $8,602 | $336,940 | $157,980 | $178,960 |
| 2017 | $7,161 | $266,290 | $132,710 | $133,580 |
| 2016 | $6,955 | $266,290 | $132,710 | $133,580 |
| 2015 | $6,772 | $266,290 | $132,710 | $133,580 |
| 2014 | $6,601 | $266,290 | $132,710 | $133,580 |
Source: Public Records
Map
Nearby Homes
- 49 Plymouth Rd
- 88 Pine Hill Ave
- 102 Pine Hill Ave Unit A2
- 76 Plymouth Rd
- 53 Morris St
- 49 Morris St
- 59 Holbrook Dr
- 75 Coolidge Ave
- 180 Colonial Rd Unit A8
- 51 Glendale Rd
- 29 Pierce Place
- 8 Windell Place
- 100 Hope St Unit 8
- 26 Douglas Ave Unit B
- 1 Strawberry Hill Ct Unit 2B
- 1 Strawberry Hill Ct Unit 1A
- 71 Deleo Dr
- 21 Holcomb Ave
- 455 Hope St Unit 2F
- 43 Crescent St Unit 11
- 64 Colonial Rd
- 60 Colonial Rd
- 66 Colonial Rd
- 56 Colonial Rd
- 70 Colonial Rd
- 23 Plymouth Rd
- 23 Plymouth Rd Unit 1ST F
- 23 Plymouth Rd Unit 2
- 23 Plymouth Rd Unit 1
- 74 Colonial Rd
- 52 Colonial Rd
- 15 Plymouth Rd
- 59 Colonial Rd Unit 3
- 59 Colonial Rd
- 59 Colonial Rd Unit 2
- 59 Colonial Rd Unit 1
- 63 Colonial Rd
- 63 Colonial Rd Unit B
- 17 Plymouth Rd