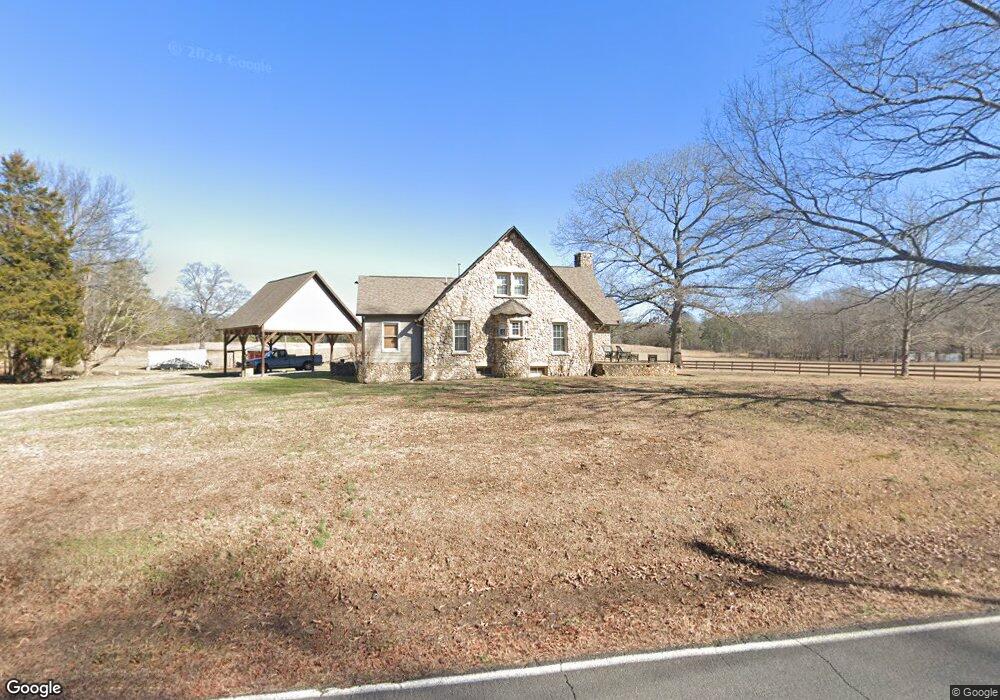
64 Deland Rd Kingston, GA 30145
Estimated Value: $181,000 - $302,000
--
Bed
--
Bath
1,617
Sq Ft
$147/Sq Ft
Est. Value
About This Home
This home is located at 64 Deland Rd, Kingston, GA 30145 and is currently estimated at $238,131, approximately $147 per square foot. 64 Deland Rd is a home located in Floyd County with nearby schools including Model Middle School and Model High School.
Ownership History
Date
Name
Owned For
Owner Type
Purchase Details
Closed on
Aug 10, 2016
Sold by
Michael Bradley
Bought by
Prater Bradley M and Prater Chrystial L
Current Estimated Value
Purchase Details
Closed on
Sep 25, 2013
Sold by
Prater Bradley Martin
Bought by
Prater Bradley M and Prater Chrystial L
Home Financials for this Owner
Home Financials are based on the most recent Mortgage that was taken out on this home.
Original Mortgage
$71,089
Interest Rate
4.53%
Mortgage Type
New Conventional
Purchase Details
Closed on
May 2, 2012
Sold by
Benson Barry K
Bought by
Prater Bradley Martin
Purchase Details
Closed on
Nov 10, 1994
Bought by
Benson Barry K and Benson Valerie P
Create a Home Valuation Report for This Property
The Home Valuation Report is an in-depth analysis detailing your home's value as well as a comparison with similar homes in the area
Home Values in the Area
Average Home Value in this Area
Purchase History
| Date | Buyer | Sale Price | Title Company |
|---|---|---|---|
| Prater Bradley M | -- | -- | |
| Prater Bradley M | -- | -- | |
| Prater Bradley Martin | $45,000 | -- | |
| Prater Bradley Martin | -- | -- | |
| Benson Barry K | -- | -- |
Source: Public Records
Mortgage History
| Date | Status | Borrower | Loan Amount |
|---|---|---|---|
| Previous Owner | Prater Bradley M | $71,089 |
Source: Public Records
Tax History Compared to Growth
Tax History
| Year | Tax Paid | Tax Assessment Tax Assessment Total Assessment is a certain percentage of the fair market value that is determined by local assessors to be the total taxable value of land and additions on the property. | Land | Improvement |
|---|---|---|---|---|
| 2024 | $3,024 | $96,406 | $9,825 | $86,581 |
| 2023 | $2,758 | $80,498 | $8,932 | $71,566 |
| 2022 | $1,899 | $63,998 | $7,300 | $56,698 |
| 2021 | $1,483 | $49,132 | $6,656 | $42,476 |
| 2020 | $1,266 | $41,599 | $5,787 | $35,812 |
| 2019 | $1,177 | $39,198 | $5,787 | $33,411 |
| 2018 | $1,099 | $36,522 | $5,512 | $31,010 |
| 2017 | $1,045 | $34,667 | $5,104 | $29,563 |
| 2016 | $1,027 | $33,644 | $5,080 | $28,564 |
| 2015 | $537 | $33,644 | $5,080 | $28,564 |
| 2014 | $537 | $33,644 | $5,080 | $28,564 |
Source: Public Records
Map
Nearby Homes
- 1849 Morrison Camp Ground Rd NE
- 127 Branson Rd SE
- 12 Winterberry Ln SE
- 158 Sproull Rd SE
- 0 Mountain Creek Dr SE Unit 10436191
- 30 Mountain Creek Dr SE
- 96 Collins Rd NE
- 7 Trimble Way SE
- 818 Morrison Camp Ground Rd NE
- 567 Fred Kelley Rd NE
- 291 Youngs Mill Rd
- 139 Shoals Ferry Rd SE
- 406 Fred Kelly Rd NE
- 21 Everwood Ct SE
- 370 Youngs Mill Rd
- 0 Fallen Branch Cir SE Unit 7397536
- 0 Fallen Branch Cir SE Unit 10311756
- 0 Fallen Branch Cir SE Unit 7234792
- 0 Fallen Branch Cir SE Unit 10172755
- 16 Fallen Branch Cir SE
- 107 Deland Rd
- 100 Deland Rd
- 67 Deland Rd
- 3575 Kingston Hwy NE
- 3601 Kingston Hwy NE
- 126 Deland Rd
- 321 Acorn Rd SE
- 343 Acorn Rd SE
- 363 Acorn Rd SE
- 3661 Kingston Hwy
- 0 Branson Rd SE Unit 6009501
- 0 Branson Rd SE Unit 8330921
- 0 Branson Rd SE Unit 7513457
- 0 Branson Rd SE Unit Tract 1 8141264
- 0 Branson Rd SE Unit Tract 2 8142393
- 0 Branson Rd SE
- 0 Branson Rd SE Unit 6880070
- 0 Branson Rd SE Unit 6880023
- 0 Branson Rd SE Unit Tract 1 8973915
- 0 Branson Rd SE Unit Tract 2 8973913