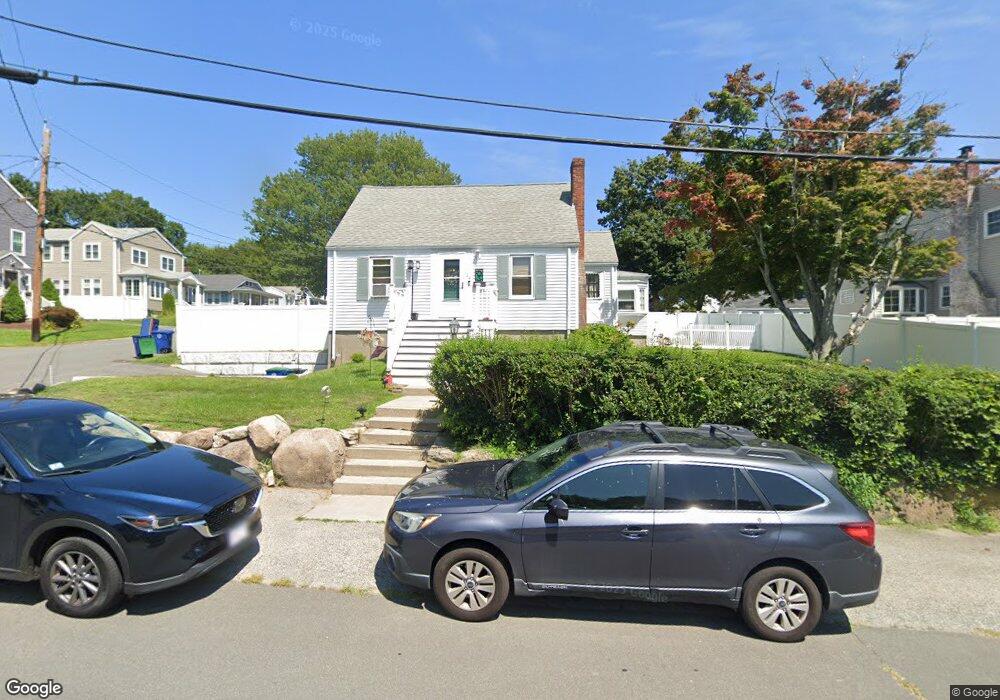
64 Dobson Rd Braintree, MA 02184
East Braintree NeighborhoodEstimated Value: $578,000 - $701,000
3
Beds
2
Baths
1,152
Sq Ft
$557/Sq Ft
Est. Value
About This Home
This home is located at 64 Dobson Rd, Braintree, MA 02184 and is currently estimated at $641,678, approximately $557 per square foot. 64 Dobson Rd is a home located in Norfolk County with nearby schools including Braintree High School, Step Ahead Kindergarten, and Noble Academy.
Ownership History
Date
Name
Owned For
Owner Type
Purchase Details
Closed on
Jul 27, 2004
Sold by
Lohan Mark and Lohan Mary
Bought by
Mccolgan Donald M and Mccolgan Patricia A
Current Estimated Value
Home Financials for this Owner
Home Financials are based on the most recent Mortgage that was taken out on this home.
Original Mortgage
$278,000
Outstanding Balance
$140,412
Interest Rate
6.28%
Mortgage Type
Purchase Money Mortgage
Estimated Equity
$501,266
Purchase Details
Closed on
May 27, 1999
Sold by
Bono Anthony R and Bono Agnes
Bought by
Lohan Mark and Lohan Mary
Create a Home Valuation Report for This Property
The Home Valuation Report is an in-depth analysis detailing your home's value as well as a comparison with similar homes in the area
Home Values in the Area
Average Home Value in this Area
Purchase History
| Date | Buyer | Sale Price | Title Company |
|---|---|---|---|
| Mccolgan Donald M | $347,500 | -- | |
| Lohan Mark | $184,000 | -- |
Source: Public Records
Mortgage History
| Date | Status | Borrower | Loan Amount |
|---|---|---|---|
| Open | Mccolgan Donald M | $278,000 | |
| Closed | Mccolgan Donald M | $34,750 | |
| Previous Owner | Lohan Mark | $192,000 |
Source: Public Records
Tax History
| Year | Tax Paid | Tax Assessment Tax Assessment Total Assessment is a certain percentage of the fair market value that is determined by local assessors to be the total taxable value of land and additions on the property. | Land | Improvement |
|---|---|---|---|---|
| 2025 | $5,721 | $573,200 | $360,500 | $212,700 |
| 2024 | $5,202 | $548,700 | $338,000 | $210,700 |
| 2023 | $4,850 | $496,900 | $297,400 | $199,500 |
| 2022 | $4,676 | $469,900 | $270,400 | $199,500 |
| 2021 | $4,085 | $410,600 | $228,000 | $182,600 |
| 2020 | $4,049 | $410,600 | $228,000 | $182,600 |
| 2019 | $3,995 | $395,900 | $228,000 | $167,900 |
| 2018 | $3,788 | $359,400 | $198,300 | $161,100 |
| 2017 | $3,595 | $334,700 | $180,300 | $154,400 |
| 2016 | $3,427 | $312,100 | $162,200 | $149,900 |
| 2015 | $3,353 | $302,900 | $158,600 | $144,300 |
| 2014 | $3,187 | $279,100 | $146,000 | $133,100 |
Source: Public Records
Map
Nearby Homes
- 18 Hobart St
- 30 Skyline Dr Unit 6
- 300 Commercial St Unit 23
- 37 Skyline Dr Unit 11
- 82 Cotton Ave
- 599 Union St
- 54 Edgemont Rd
- 25 W Howard St Unit C3
- 14 Hillside Rd
- 15 Bower Rd Unit F9
- 140 Commercial St
- 41 Lantern Ln
- 37 Lantern Ln
- 17 White Rd
- 67 Trefton Dr
- 200 Falls Blvd Unit E101
- 200 Falls Blvd Unit B305
- 21 Spaulding St
- 86 E Howard St Unit 107
- 87 Arborway Dr
Your Personal Tour Guide
Ask me questions while you tour the home.