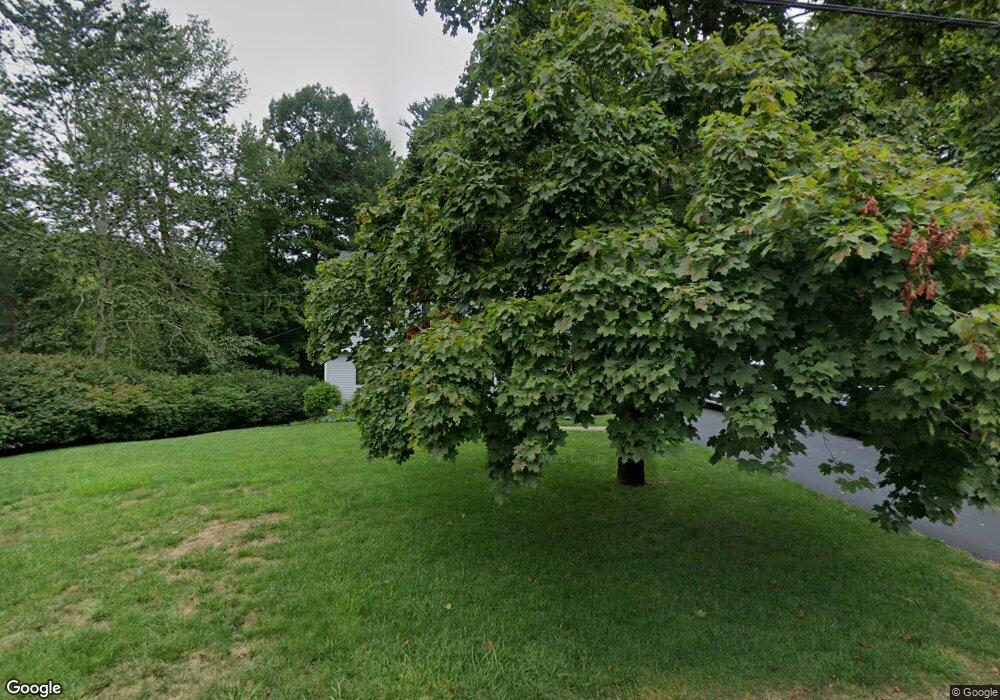
64 Donna Dr Hanover, MA 02339
Estimated Value: $898,000 - $1,128,000
4
Beds
2
Baths
2,136
Sq Ft
$481/Sq Ft
Est. Value
About This Home
This home is located at 64 Donna Dr, Hanover, MA 02339 and is currently estimated at $1,028,076, approximately $481 per square foot. 64 Donna Dr is a home located in Plymouth County with nearby schools including Hanover High School, Cadence Academy Preschool - Hanover, and The Master's Academy.
Ownership History
Date
Name
Owned For
Owner Type
Purchase Details
Closed on
Sep 1, 2006
Sold by
Carney John F and Carney Jeannette
Bought by
Condon Daniel F and Condon Jill M
Current Estimated Value
Home Financials for this Owner
Home Financials are based on the most recent Mortgage that was taken out on this home.
Original Mortgage
$205,000
Interest Rate
6.83%
Mortgage Type
Purchase Money Mortgage
Create a Home Valuation Report for This Property
The Home Valuation Report is an in-depth analysis detailing your home's value as well as a comparison with similar homes in the area
Home Values in the Area
Average Home Value in this Area
Purchase History
| Date | Buyer | Sale Price | Title Company |
|---|---|---|---|
| Condon Daniel F | $555,000 | -- | |
| Condon Daniel F | $555,000 | -- |
Source: Public Records
Mortgage History
| Date | Status | Borrower | Loan Amount |
|---|---|---|---|
| Open | Condon Daniel F | $225,000 | |
| Closed | Condon Daniel F | $205,000 | |
| Closed | Condon Daniel F | $205,000 |
Source: Public Records
Tax History
| Year | Tax Paid | Tax Assessment Tax Assessment Total Assessment is a certain percentage of the fair market value that is determined by local assessors to be the total taxable value of land and additions on the property. | Land | Improvement |
|---|---|---|---|---|
| 2025 | $10,858 | $879,200 | $325,000 | $554,200 |
| 2024 | $10,596 | $825,200 | $325,000 | $500,200 |
| 2023 | $10,077 | $747,000 | $295,300 | $451,700 |
| 2022 | $9,287 | $609,000 | $246,100 | $362,900 |
| 2021 | $9,124 | $558,700 | $223,800 | $334,900 |
| 2020 | $8,869 | $543,800 | $223,800 | $320,000 |
| 2019 | $8,581 | $522,900 | $223,800 | $299,100 |
| 2018 | $8,302 | $493,200 | $223,800 | $269,400 |
| 2017 | $8,245 | $499,100 | $233,700 | $265,400 |
| 2016 | $7,668 | $454,800 | $212,500 | $242,300 |
| 2015 | $7,657 | $474,100 | $231,800 | $242,300 |
Source: Public Records
Map
Nearby Homes
Your Personal Tour Guide
Ask me questions while you tour the home.