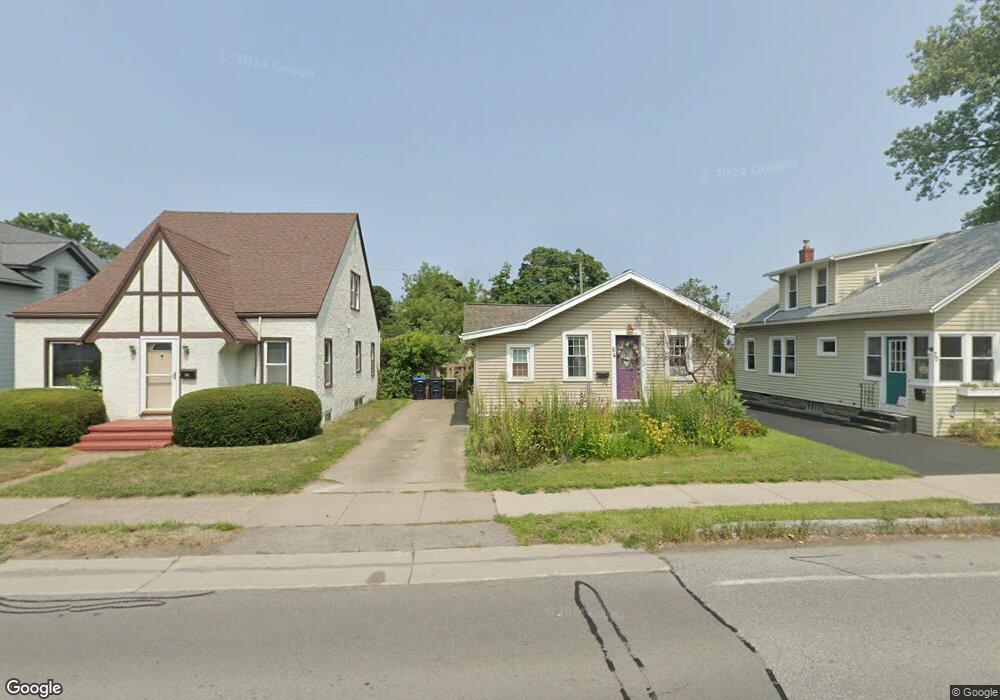
64 Durand Blvd Rochester, NY 14622
Estimated Value: $148,000 - $169,000
2
Beds
1
Bath
720
Sq Ft
$227/Sq Ft
Est. Value
About This Home
This home is located at 64 Durand Blvd, Rochester, NY 14622 and is currently estimated at $163,185, approximately $226 per square foot. 64 Durand Blvd is a home located in Monroe County with nearby schools including East Irondequoit Middle School, Eastridge Senior High School, and Bay Knoll Seventh-day Adventist School.
Ownership History
Date
Name
Owned For
Owner Type
Purchase Details
Closed on
Jun 16, 2010
Sold by
Fazackerley Carole A
Bought by
Girard Tonya and Eakins Aaron B
Current Estimated Value
Home Financials for this Owner
Home Financials are based on the most recent Mortgage that was taken out on this home.
Original Mortgage
$48,000
Outstanding Balance
$32,264
Interest Rate
5.03%
Mortgage Type
New Conventional
Estimated Equity
$130,921
Purchase Details
Closed on
Oct 14, 2005
Sold by
Johns Scott
Bought by
Fazackerley Carole
Purchase Details
Closed on
Aug 30, 2000
Sold by
Eckrich Kenneth J
Bought by
Johns Scott
Purchase Details
Closed on
Mar 16, 2000
Sold by
Hsbc Mortgage Corp/Usa
Bought by
Eckrich Kenneth J
Purchase Details
Closed on
Dec 22, 1999
Sold by
Howie Patricia A
Bought by
Hsbc Mortgage Corp Usa
Purchase Details
Closed on
Oct 29, 1998
Sold by
Thomas Jerome
Bought by
Howie Patricia
Create a Home Valuation Report for This Property
The Home Valuation Report is an in-depth analysis detailing your home's value as well as a comparison with similar homes in the area
Home Values in the Area
Average Home Value in this Area
Purchase History
| Date | Buyer | Sale Price | Title Company |
|---|---|---|---|
| Girard Tonya | $61,000 | None Available | |
| Fazackerley Carole | $63,000 | William Dedes | |
| Johns Scott | $54,500 | Steve, Sr Butcher | |
| Eckrich Kenneth J | $32,000 | Michael Labue | |
| Hsbc Mortgage Corp Usa | $35,564 | -- | |
| Howie Patricia | $48,500 | -- |
Source: Public Records
Mortgage History
| Date | Status | Borrower | Loan Amount |
|---|---|---|---|
| Open | Girard Tonya | $48,000 |
Source: Public Records
Tax History Compared to Growth
Tax History
| Year | Tax Paid | Tax Assessment Tax Assessment Total Assessment is a certain percentage of the fair market value that is determined by local assessors to be the total taxable value of land and additions on the property. | Land | Improvement |
|---|---|---|---|---|
| 2024 | $3,974 | $124,000 | $24,000 | $100,000 |
| 2023 | $3,850 | $124,000 | $24,000 | $100,000 |
| 2022 | $3,702 | $69,400 | $22,300 | $47,100 |
| 2021 | $3,637 | $69,400 | $22,300 | $47,100 |
| 2020 | $2,678 | $69,400 | $22,300 | $47,100 |
| 2019 | $2,356 | $69,400 | $22,300 | $47,100 |
| 2018 | $2,533 | $69,400 | $22,300 | $47,100 |
| 2017 | $1,033 | $63,000 | $14,500 | $48,500 |
| 2016 | $2,356 | $63,000 | $14,500 | $48,500 |
| 2015 | -- | $63,000 | $14,500 | $48,500 |
| 2014 | -- | $63,000 | $14,500 | $48,500 |
Source: Public Records
Map
Nearby Homes
- 56 Durand Blvd
- 70 Durand Blvd
- 70 Durand Blvd
- 54 Durand Blvd
- 48 Durand Blvd
- 60 Maryknoll Park
- 54 Maryknoll Park
- 59 Durand Blvd
- 65 Durand Blvd
- 66 Maryknoll Park
- 50 Maryknoll Park
- 71 Durand Blvd
- 53 Durand Blvd
- 44 Maryknoll Park
- 38 Durand Blvd
- 40 Maryknoll Park
- 45 Durand Blvd
- 34 Maryknoll Park
- 32 Durand Blvd
- 39 Durand Blvd