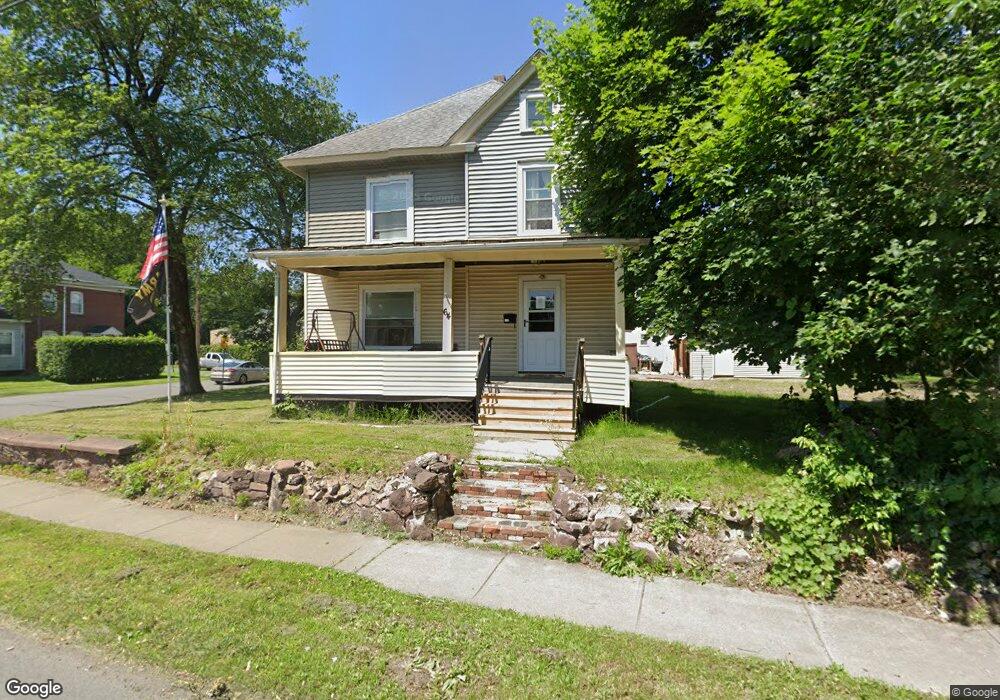
64 Elm St Greenfield, MA 01301
Estimated Value: $225,000 - $308,000
4
Beds
1
Bath
1,672
Sq Ft
$169/Sq Ft
Est. Value
About This Home
This home is located at 64 Elm St, Greenfield, MA 01301 and is currently estimated at $282,298, approximately $168 per square foot. 64 Elm St is a home located in Franklin County with nearby schools including Four Rivers Charter Public School and Cornerstone Christian School.
Ownership History
Date
Name
Owned For
Owner Type
Purchase Details
Closed on
Sep 1, 1999
Sold by
Greene Tr Dennis J
Bought by
Curtis John S and Curtis Cynthia A
Current Estimated Value
Home Financials for this Owner
Home Financials are based on the most recent Mortgage that was taken out on this home.
Original Mortgage
$83,640
Interest Rate
7.5%
Mortgage Type
Purchase Money Mortgage
Create a Home Valuation Report for This Property
The Home Valuation Report is an in-depth analysis detailing your home's value as well as a comparison with similar homes in the area
Home Values in the Area
Average Home Value in this Area
Purchase History
| Date | Buyer | Sale Price | Title Company |
|---|---|---|---|
| Curtis John S | $82,000 | -- | |
| Curtis John S | $82,000 | -- |
Source: Public Records
Mortgage History
| Date | Status | Borrower | Loan Amount |
|---|---|---|---|
| Open | Curtis John S | $57,748 | |
| Open | Curtis John S | $85,550 | |
| Closed | Curtis John S | $83,640 |
Source: Public Records
Tax History
| Year | Tax Paid | Tax Assessment Tax Assessment Total Assessment is a certain percentage of the fair market value that is determined by local assessors to be the total taxable value of land and additions on the property. | Land | Improvement |
|---|---|---|---|---|
| 2025 | $5,371 | $274,600 | $47,500 | $227,100 |
| 2024 | $5,481 | $268,800 | $43,300 | $225,500 |
| 2023 | $4,913 | $250,000 | $43,300 | $206,700 |
| 2022 | $4,736 | $212,200 | $41,300 | $170,900 |
| 2021 | $4,584 | $197,400 | $44,400 | $153,000 |
| 2020 | $4,295 | $187,300 | $40,200 | $147,100 |
| 2019 | $4,074 | $182,200 | $35,100 | $147,100 |
| 2018 | $4,002 | $178,400 | $34,400 | $144,000 |
| 2017 | $3,877 | $178,400 | $34,400 | $144,000 |
| 2016 | $3,692 | $169,300 | $29,900 | $139,400 |
| 2015 | $3,644 | $161,900 | $30,300 | $131,600 |
| 2014 | $3,328 | $162,100 | $30,300 | $131,800 |
Source: Public Records
Map
Nearby Homes
- 11 Colrain St
- 59-61 Conway St
- 173-175 Conway St
- 11 Conway St
- 159 Chapman St
- 13 River St
- 23 Robbins Rd
- 8 Water St
- 2 Water St
- 52 Prospect St Unit A
- 71 Washington St
- 73 Washington St
- 77 Washington St
- 0 Marshall St
- 171 Cleveland St
- 37 Cleveland St
- 208 Silver St
- 62 Peabody Ln
- 427-429 Deerfield St
- 306 Country Side Rd
Your Personal Tour Guide
Ask me questions while you tour the home.