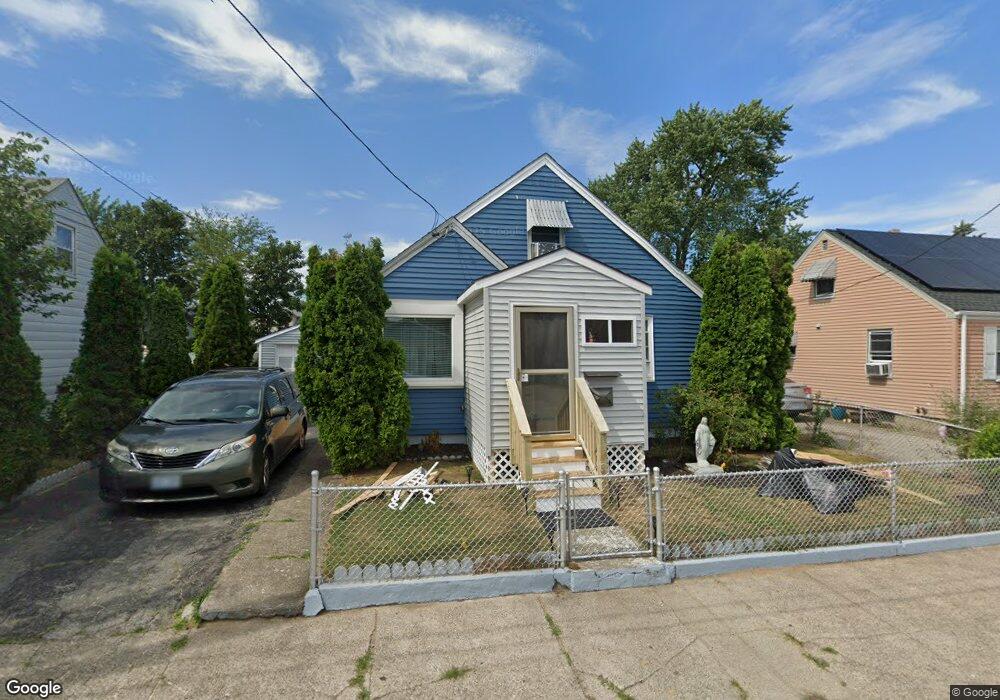
64 Ferris St Unit 1 Pawtucket, RI 02861
Darlington NeighborhoodEstimated Value: $395,000 - $459,000
3
Beds
2
Baths
1,500
Sq Ft
$279/Sq Ft
Est. Value
About This Home
This home is located at 64 Ferris St Unit 1, Pawtucket, RI 02861 and is currently estimated at $418,991, approximately $279 per square foot. 64 Ferris St Unit 1 is a home located in Providence County with nearby schools including Saint Teresa Catholic Elementary School, St Cecilia School, and Saint Raphael Academy.
Ownership History
Date
Name
Owned For
Owner Type
Purchase Details
Closed on
May 19, 2025
Sold by
Burns Nancy M
Bought by
Guevara Argentina M and Guevara Gustavo E
Current Estimated Value
Home Financials for this Owner
Home Financials are based on the most recent Mortgage that was taken out on this home.
Original Mortgage
$394,718
Outstanding Balance
$391,886
Interest Rate
6.64%
Mortgage Type
FHA
Estimated Equity
$27,105
Purchase Details
Closed on
Aug 1, 2014
Sold by
Sousa Armindo B
Bought by
Burns Nancy M
Home Financials for this Owner
Home Financials are based on the most recent Mortgage that was taken out on this home.
Original Mortgage
$141,550
Interest Rate
4.18%
Mortgage Type
New Conventional
Purchase Details
Closed on
Apr 2, 2012
Sold by
Us Bank Na
Bought by
Sousa Armindo B
Purchase Details
Closed on
Nov 15, 2011
Sold by
Simas Duarte M
Bought by
Us Bank Na
Purchase Details
Closed on
Aug 21, 1995
Sold by
Pimental Artur C and Pimental Jorgina
Bought by
Simas Duarte M and Simas Eusebia
Create a Home Valuation Report for This Property
The Home Valuation Report is an in-depth analysis detailing your home's value as well as a comparison with similar homes in the area
Home Values in the Area
Average Home Value in this Area
Purchase History
| Date | Buyer | Sale Price | Title Company |
|---|---|---|---|
| Guevara Argentina M | $402,000 | None Available | |
| Guevara Argentina M | $402,000 | None Available | |
| Burns Nancy M | $149,000 | -- | |
| Burns Nancy M | $149,000 | -- | |
| Sousa Armindo B | -- | -- | |
| Sousa Armindo B | -- | -- | |
| Us Bank Na | $111,920 | -- | |
| Us Bank Na | $111,920 | -- | |
| Simas Duarte M | $82,000 | -- | |
| Simas Duarte M | $82,000 | -- |
Source: Public Records
Mortgage History
| Date | Status | Borrower | Loan Amount |
|---|---|---|---|
| Open | Guevara Argentina M | $394,718 | |
| Closed | Guevara Argentina M | $394,718 | |
| Previous Owner | Burns Nancy M | $141,550 | |
| Previous Owner | Simas Duarte M | $185,000 |
Source: Public Records
Tax History
| Year | Tax Paid | Tax Assessment Tax Assessment Total Assessment is a certain percentage of the fair market value that is determined by local assessors to be the total taxable value of land and additions on the property. | Land | Improvement |
|---|---|---|---|---|
| 2025 | $3,798 | $288,800 | $127,500 | $161,300 |
| 2024 | $3,564 | $288,800 | $127,500 | $161,300 |
| 2023 | $3,786 | $223,500 | $85,700 | $137,800 |
| 2022 | $3,706 | $223,500 | $85,700 | $137,800 |
| 2021 | $3,706 | $223,500 | $85,700 | $137,800 |
| 2020 | $3,637 | $174,100 | $70,800 | $103,300 |
| 2019 | $3,637 | $174,100 | $70,800 | $103,300 |
| 2018 | $3,505 | $174,100 | $70,800 | $103,300 |
| 2017 | $3,647 | $160,500 | $64,500 | $96,000 |
| 2016 | $3,513 | $160,500 | $64,500 | $96,000 |
| 2015 | $3,513 | $160,500 | $64,500 | $96,000 |
| 2014 | $3,385 | $146,800 | $61,500 | $85,300 |
Source: Public Records
Map
Nearby Homes
Your Personal Tour Guide
Ask me questions while you tour the home.