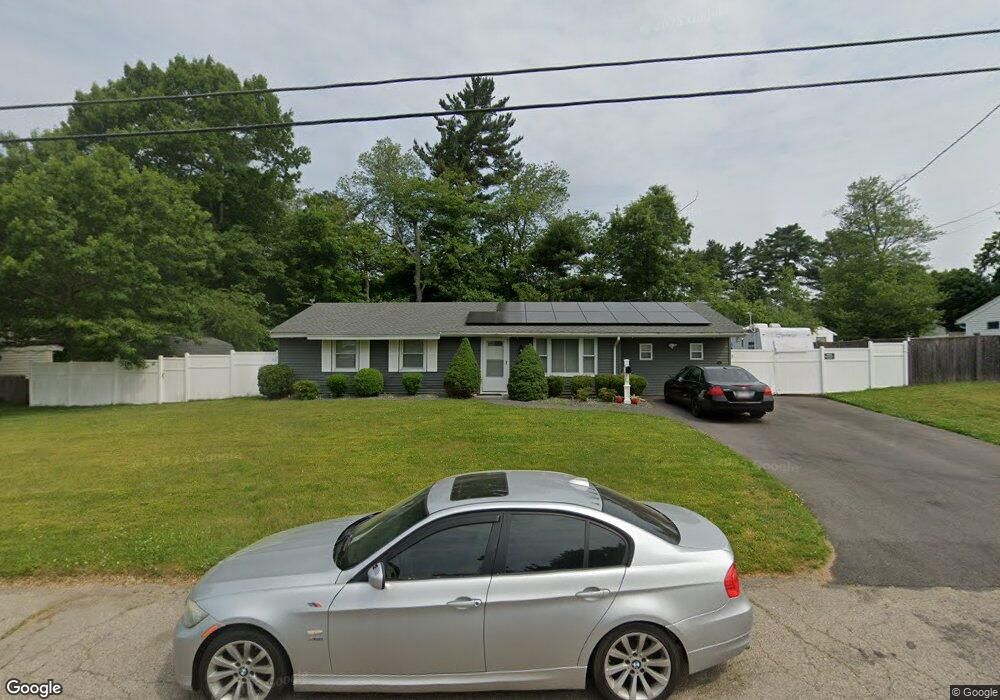
64 Foothill Rd Brockton, MA 02302
Estimated Value: $438,000 - $511,000
3
Beds
1
Bath
1,316
Sq Ft
$356/Sq Ft
Est. Value
About This Home
This home is located at 64 Foothill Rd, Brockton, MA 02302 and is currently estimated at $468,888, approximately $356 per square foot. 64 Foothill Rd is a home located in Plymouth County with nearby schools including Gilmore Elementary School, Davis K-8 School, and John F. Kennedy Elementary School.
Ownership History
Date
Name
Owned For
Owner Type
Purchase Details
Closed on
Nov 14, 2023
Sold by
Lemus Damaris
Bought by
Cruz Efrain
Current Estimated Value
Purchase Details
Closed on
May 3, 2006
Sold by
Cruz Damaris
Bought by
Cruz Damaris and Cruz Efrain
Purchase Details
Closed on
Mar 24, 2006
Sold by
Szeto Ching and Szeto Wai
Bought by
Cruz Damaris and Cruz Efrain
Purchase Details
Closed on
Sep 28, 1988
Sold by
Myrtle St Rt Broc
Bought by
Szeto Ching
Create a Home Valuation Report for This Property
The Home Valuation Report is an in-depth analysis detailing your home's value as well as a comparison with similar homes in the area
Purchase History
| Date | Buyer | Sale Price | Title Company |
|---|---|---|---|
| Cruz Efrain | -- | None Available | |
| Cruz Damaris | $262,500 | -- | |
| Cruz Damaris | $262,500 | -- | |
| Szeto Ching | $127,000 | -- |
Source: Public Records
Mortgage History
| Date | Status | Borrower | Loan Amount |
|---|---|---|---|
| Previous Owner | Szeto Ching | $224,000 | |
| Previous Owner | Szeto Ching | $56,000 |
Source: Public Records
Tax History
| Year | Tax Paid | Tax Assessment Tax Assessment Total Assessment is a certain percentage of the fair market value that is determined by local assessors to be the total taxable value of land and additions on the property. | Land | Improvement |
|---|---|---|---|---|
| 2025 | $4,484 | $370,300 | $162,800 | $207,500 |
| 2024 | $4,422 | $367,900 | $162,800 | $205,100 |
| 2023 | $4,199 | $323,500 | $113,100 | $210,400 |
| 2022 | $4,111 | $294,300 | $102,900 | $191,400 |
| 2021 | $3,854 | $265,800 | $96,300 | $169,500 |
| 2020 | $3,953 | $260,900 | $84,200 | $176,700 |
| 2019 | $3,473 | $223,500 | $80,700 | $142,800 |
| 2018 | $3,421 | $213,000 | $80,700 | $132,300 |
| 2017 | $2,846 | $176,800 | $80,700 | $96,100 |
| 2016 | $3,068 | $176,700 | $76,900 | $99,800 |
| 2015 | $2,877 | $158,500 | $76,900 | $81,600 |
| 2014 | $2,837 | $156,500 | $76,900 | $79,600 |
Source: Public Records
Map
Nearby Homes
- 15 Wachusetts Rd
- 12 Paulin Ave
- 118 Deanna Rd
- 23 Dondi Rd
- 549 Summer St
- 383 Summer St
- 111 Riverview St
- 100 Concord St
- 578 Plain St
- 41 Riverview St
- 4 Virginia Ave
- 231 Winter St
- 107 N Leyden St
- 1 Winter St
- 223 Clinton St Unit 16
- 1 Thomas Cir
- 23 E Chestnut St
- 24 E Chestnut St
- 55 Marjan Dr
- 103 Clinton St
Your Personal Tour Guide
Ask me questions while you tour the home.