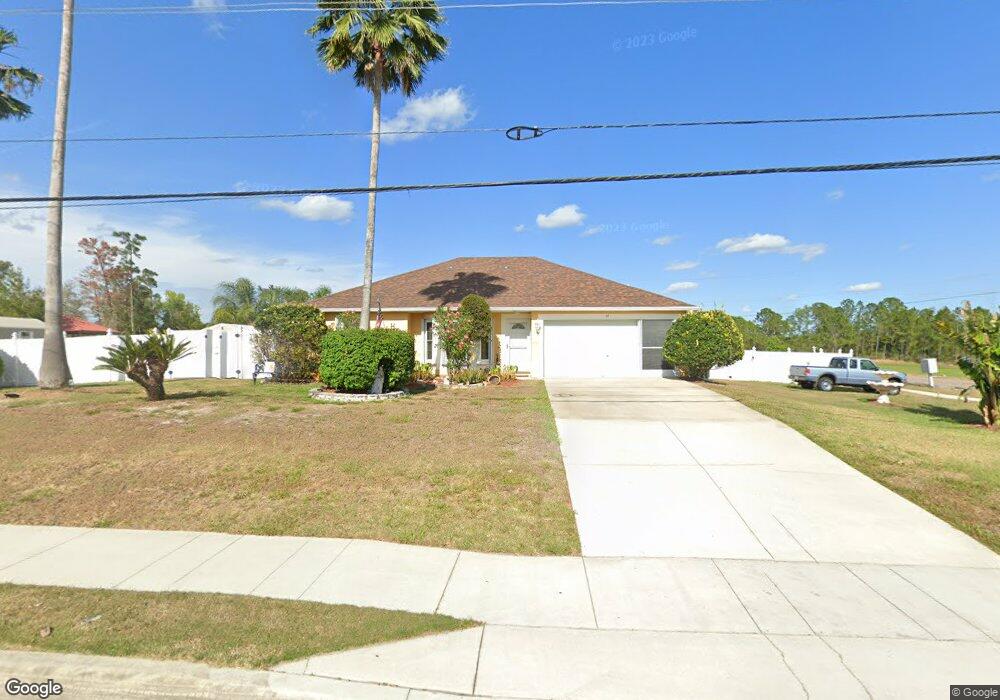
64 Fort Smith Blvd Deltona, FL 32738
Estimated Value: $286,370 - $299,000
3
Beds
2
Baths
1,710
Sq Ft
$171/Sq Ft
Est. Value
About This Home
This home is located at 64 Fort Smith Blvd, Deltona, FL 32738 and is currently estimated at $291,843, approximately $170 per square foot. 64 Fort Smith Blvd is a home located in Volusia County with nearby schools including Pride Elementary School, Heritage Middle School, and Pine Ridge High School.
Ownership History
Date
Name
Owned For
Owner Type
Purchase Details
Closed on
Sep 30, 2014
Sold by
Cortes Catherine and Cortes Irizarry Catherine
Bought by
Lafontaine Randall P and Lafontaine Sharon A
Current Estimated Value
Home Financials for this Owner
Home Financials are based on the most recent Mortgage that was taken out on this home.
Original Mortgage
$94,810
Outstanding Balance
$72,819
Interest Rate
4.15%
Mortgage Type
New Conventional
Estimated Equity
$219,024
Purchase Details
Closed on
Oct 5, 2009
Sold by
Cortes Catherine
Bought by
Cortes Catherine and Cabo Richard
Purchase Details
Closed on
Oct 16, 1998
Sold by
Manzano Luis and Manzano Santa
Bought by
Cortes Catherine
Purchase Details
Closed on
Apr 14, 1997
Sold by
Martinez Lydia R
Bought by
Manzano Luis and Manzano Santa
Purchase Details
Closed on
Jan 15, 1992
Bought by
Lafontaine Randall P
Purchase Details
Closed on
Jan 15, 1977
Bought by
Lafontaine Randall P
Create a Home Valuation Report for This Property
The Home Valuation Report is an in-depth analysis detailing your home's value as well as a comparison with similar homes in the area
Home Values in the Area
Average Home Value in this Area
Purchase History
| Date | Buyer | Sale Price | Title Company |
|---|---|---|---|
| Lafontaine Randall P | $99,800 | Landmark Title Services Llc | |
| Cortes Catherine | -- | Attorney | |
| Cortes Catherine | $10,800 | -- | |
| Manzano Luis | $10,000 | -- | |
| Lafontaine Randall P | $100 | -- | |
| Lafontaine Randall P | $2,100 | -- |
Source: Public Records
Mortgage History
| Date | Status | Borrower | Loan Amount |
|---|---|---|---|
| Open | Lafontaine Randall P | $94,810 |
Source: Public Records
Tax History Compared to Growth
Tax History
| Year | Tax Paid | Tax Assessment Tax Assessment Total Assessment is a certain percentage of the fair market value that is determined by local assessors to be the total taxable value of land and additions on the property. | Land | Improvement |
|---|---|---|---|---|
| 2025 | $1,332 | $99,801 | -- | -- |
| 2024 | $1,332 | $96,989 | -- | -- |
| 2023 | $1,332 | $94,165 | $0 | $0 |
| 2022 | $1,303 | $91,422 | $0 | $0 |
| 2021 | $1,313 | $88,759 | $0 | $0 |
| 2020 | $1,292 | $87,534 | $0 | $0 |
| 2019 | $1,289 | $85,566 | $0 | $0 |
| 2018 | $1,257 | $83,971 | $0 | $0 |
| 2017 | $1,222 | $82,244 | $0 | $0 |
| 2016 | $1,179 | $80,552 | $0 | $0 |
| 2015 | $1,157 | $78,416 | $0 | $0 |
| 2014 | -- | $60,407 | $0 | $0 |
Source: Public Records
Map
Nearby Homes
- 3441 Sandlor Dr
- 690 Colchester Ave
- 3795 Pinehurst St
- 590 Twin Lake Ave
- 144 Fort Smith Blvd
- 630 Mosquero Ave
- 3400 Trade St
- 0 Ryland St Unit MFRO6322194
- 0 Howland Blvd Unit V4908648
- 0 Howland Blvd Unit O5513139
- 0 Howland Blvd Unit MFRV4943556
- 0 Howland Blvd Unit MFRO6102246
- 3236 Phonetia Dr
- 3224 Phonetia Dr
- 583 Wilburton Dr
- 795 4th St E
- 937 Howland Blvd
- 399 Wilburton Dr
- 3519 Fernanda Dr
- 3527 Fernanda Dr
- 3634 Monument Dr
- 3650 Monument Dr
- 68 Fort Smith Blvd
- 3642 Monument Dr
- 61 Fort Smith Blvd
- 65 Fort Smith Blvd
- 72 Fort Smith Blvd
- 3619 Monument Dr
- 3611 Monument Dr
- 76 Fort Smith Blvd
- 3571 Linwood Ct
- 3602 Monument Dr
- 51 Fort Smith Blvd
- 3710 Pamona St
- 3660 Monument Dr
- 3702 Pamona St
- 3603 Monument Dr
- 3578 Linwood Ct
- 3620 Apple Orchard St
- 3694 Pamona St