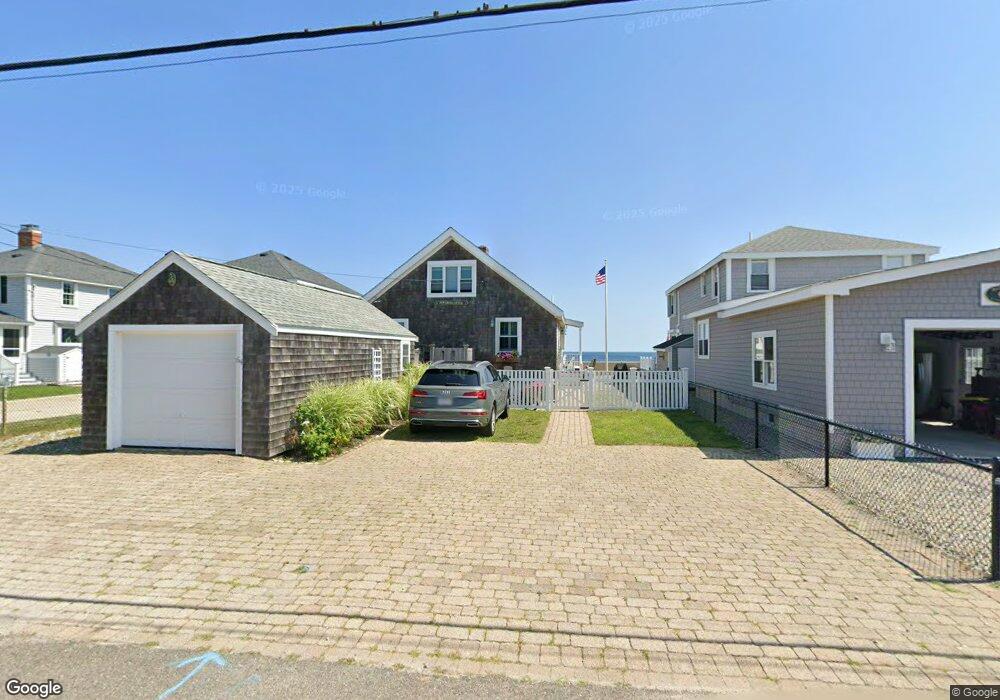
64 Foster Ave Marshfield, MA 02050
Ocean Bluff-Brant Rock NeighborhoodEstimated Value: $896,000 - $1,264,000
3
Beds
2
Baths
1,494
Sq Ft
$715/Sq Ft
Est. Value
About This Home
This home is located at 64 Foster Ave, Marshfield, MA 02050 and is currently estimated at $1,068,626, approximately $715 per square foot. 64 Foster Ave is a home with nearby schools including Daniel Webster, Furnace Brook Middle School, and Marshfield High School.
Ownership History
Date
Name
Owned For
Owner Type
Purchase Details
Closed on
Jul 29, 2022
Sold by
Kevin J Mcgillicuddy Ret and Mcgillicuddy
Bought by
Mcgillicuddy Ft and Oreilly
Current Estimated Value
Purchase Details
Closed on
Jan 24, 2019
Sold by
Mcgillicuddy
Bought by
Kevin J Mcgillicuddy Ret and Mcgillicuddy
Purchase Details
Closed on
Aug 13, 2004
Sold by
Mcgillicuddy Kevin J and Mcgillicuddy Anne M
Bought by
Mcgillicuddy Kevin J and Mcgillicuddy Anne M
Purchase Details
Closed on
May 12, 1987
Sold by
Oconnell Gregory H
Bought by
Mcgillicuddy Kevin
Create a Home Valuation Report for This Property
The Home Valuation Report is an in-depth analysis detailing your home's value as well as a comparison with similar homes in the area
Home Values in the Area
Average Home Value in this Area
Purchase History
| Date | Buyer | Sale Price | Title Company |
|---|---|---|---|
| Mcgillicuddy Ft | -- | None Available | |
| Mcgillicuddy Ft | -- | None Available | |
| Kevin J Mcgillicuddy Ret | -- | -- | |
| Kevin J Mcgillicuddy Ret | -- | -- | |
| Mcgillicuddy Kevin J | -- | -- | |
| Mcgillicuddy Kevin J | -- | -- | |
| Mcgillicuddy Kevin | $275,000 | -- |
Source: Public Records
Mortgage History
| Date | Status | Borrower | Loan Amount |
|---|---|---|---|
| Previous Owner | Mcgillicuddy Kevin | $200,000 | |
| Previous Owner | Mcgillicuddy Kevin | $157,500 | |
| Previous Owner | Mcgillicuddy Kevin | $200,000 |
Source: Public Records
Tax History Compared to Growth
Tax History
| Year | Tax Paid | Tax Assessment Tax Assessment Total Assessment is a certain percentage of the fair market value that is determined by local assessors to be the total taxable value of land and additions on the property. | Land | Improvement |
|---|---|---|---|---|
| 2025 | $11,045 | $1,115,700 | $834,400 | $281,300 |
| 2024 | $10,507 | $1,011,300 | $755,000 | $256,300 |
| 2023 | $9,560 | $937,400 | $715,200 | $222,200 |
| 2022 | $9,560 | $738,200 | $546,400 | $191,800 |
| 2021 | $8,438 | $639,700 | $466,900 | $172,800 |
| 2020 | $8,130 | $609,900 | $437,100 | $172,800 |
| 2019 | $8,024 | $599,700 | $437,100 | $162,600 |
| 2018 | $7,920 | $592,400 | $437,100 | $155,300 |
| 2017 | $7,903 | $576,000 | $437,100 | $138,900 |
| 2016 | $7,913 | $570,100 | $437,100 | $133,000 |
| 2015 | $8,625 | $649,000 | $516,600 | $132,400 |
| 2014 | $8,006 | $602,400 | $476,800 | $125,600 |
Source: Public Records
Map
Nearby Homes