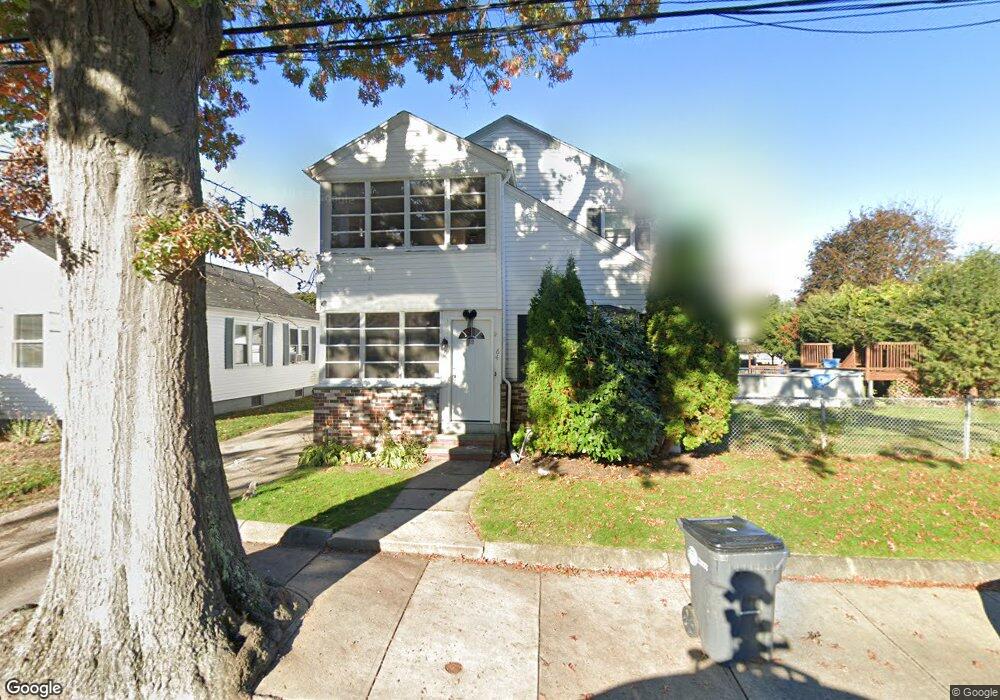
64 Hazael St Providence, RI 02908
Wanskuck NeighborhoodEstimated Value: $443,000 - $567,000
5
Beds
2
Baths
1,808
Sq Ft
$282/Sq Ft
Est. Value
About This Home
This home is located at 64 Hazael St, Providence, RI 02908 and is currently estimated at $510,112, approximately $282 per square foot. 64 Hazael St is a home located in Providence County with nearby schools including St. Pius V Catholic School, St. Augustine School, and La Salle Academy.
Ownership History
Date
Name
Owned For
Owner Type
Purchase Details
Closed on
Jun 22, 2021
Sold by
Cespedes Yulisse S
Bought by
Hurtado Miguel A
Current Estimated Value
Home Financials for this Owner
Home Financials are based on the most recent Mortgage that was taken out on this home.
Original Mortgage
$250,000
Outstanding Balance
$226,344
Interest Rate
2.9%
Mortgage Type
FHA
Estimated Equity
$283,768
Purchase Details
Closed on
Dec 30, 2003
Sold by
Micielli Anthony and Micielli Alana
Bought by
Santana-Cespedes Yulisse
Home Financials for this Owner
Home Financials are based on the most recent Mortgage that was taken out on this home.
Original Mortgage
$247,000
Interest Rate
6.01%
Mortgage Type
Purchase Money Mortgage
Purchase Details
Closed on
Sep 29, 2000
Sold by
Rivera John and Rivera Domeniza
Bought by
Micielli Anthony and Micielli Alana
Create a Home Valuation Report for This Property
The Home Valuation Report is an in-depth analysis detailing your home's value as well as a comparison with similar homes in the area
Home Values in the Area
Average Home Value in this Area
Purchase History
| Date | Buyer | Sale Price | Title Company |
|---|---|---|---|
| Hurtado Miguel A | $273,000 | None Available | |
| Santana-Cespedes Yulisse | $260,000 | -- | |
| Micielli Anthony | $137,000 | -- |
Source: Public Records
Mortgage History
| Date | Status | Borrower | Loan Amount |
|---|---|---|---|
| Open | Hurtado Miguel A | $250,000 | |
| Previous Owner | Micielli Anthony | $248,000 | |
| Previous Owner | Micielli Anthony | $40,000 | |
| Previous Owner | Micielli Anthony | $247,000 |
Source: Public Records
Tax History
| Year | Tax Paid | Tax Assessment Tax Assessment Total Assessment is a certain percentage of the fair market value that is determined by local assessors to be the total taxable value of land and additions on the property. | Land | Improvement |
|---|---|---|---|---|
| 2025 | $3,488 | $462,000 | $170,600 | $291,400 |
| 2024 | $5,661 | $308,500 | $93,600 | $214,900 |
| 2023 | $5,661 | $308,500 | $93,600 | $214,900 |
| 2022 | $5,491 | $308,500 | $93,600 | $214,900 |
| 2021 | $4,760 | $193,800 | $51,100 | $142,700 |
| 2020 | $4,760 | $193,800 | $51,100 | $142,700 |
| 2019 | $4,760 | $193,800 | $51,100 | $142,700 |
| 2018 | $4,583 | $143,400 | $43,400 | $100,000 |
| 2017 | $4,583 | $143,400 | $43,400 | $100,000 |
| 2016 | $4,583 | $143,400 | $43,400 | $100,000 |
| 2015 | $4,210 | $127,200 | $43,400 | $83,800 |
| 2014 | $4,293 | $127,200 | $43,400 | $83,800 |
| 2013 | $4,293 | $127,200 | $43,400 | $83,800 |
Source: Public Records
Map
Nearby Homes
- 115 Hazael St
- 25 Hymer St
- 835 River Ave
- 0 Wainwright St
- 876 Douglas Ave
- 73 Wainwright St
- 30 Oneil St
- 1039 Douglas Ave
- 873 Douglas Ave
- 160 Cumberland St
- 860 Douglas Ave
- 871 Douglas Ave
- 31 Joseph St
- 82 Lucille St
- 23 Concannon St
- 272 Veazie St
- 825 Douglas Ave
- 36 Hereford St
- 797 Academy Ave
- 252 Gentian Ave