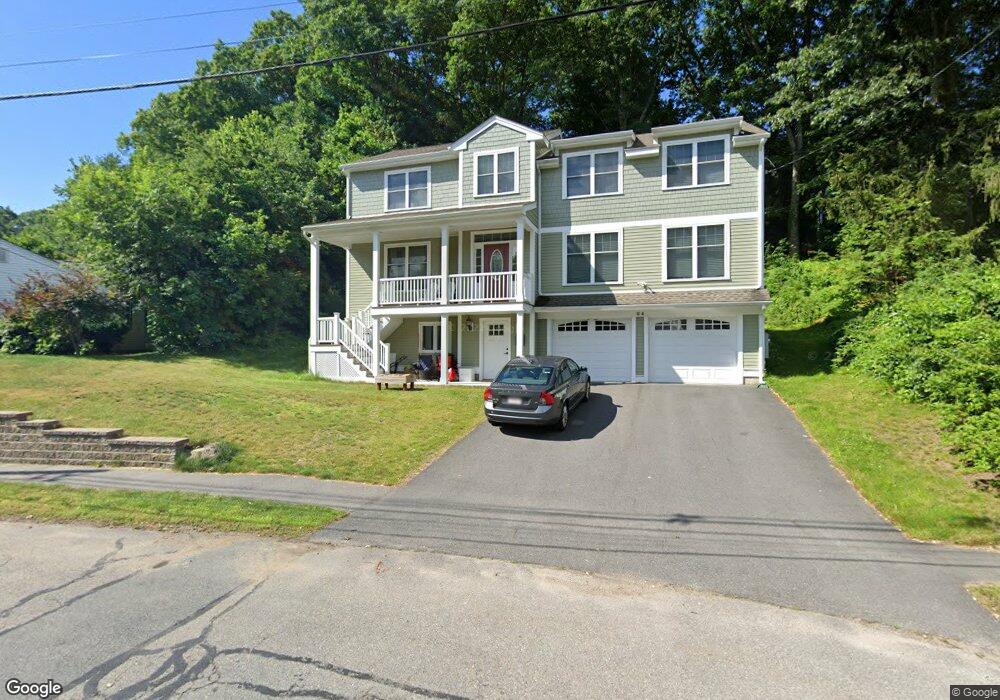
64 Helen Rd Needham, MA 02492
Estimated Value: $1,318,000 - $2,191,852
4
Beds
2
Baths
1,986
Sq Ft
$843/Sq Ft
Est. Value
About This Home
This home is located at 64 Helen Rd, Needham, MA 02492 and is currently estimated at $1,674,463, approximately $843 per square foot. 64 Helen Rd is a home located in Norfolk County with nearby schools including Broadmeadow Elementary School, High Rock Middle School, and Pollard Middle School.
Ownership History
Date
Name
Owned For
Owner Type
Purchase Details
Closed on
May 1, 2002
Sold by
Jacques Cheryl A
Bought by
Tsung Eushiuan T and Tsung Eric F
Current Estimated Value
Home Financials for this Owner
Home Financials are based on the most recent Mortgage that was taken out on this home.
Original Mortgage
$300,700
Outstanding Balance
$128,759
Interest Rate
7.13%
Mortgage Type
Purchase Money Mortgage
Estimated Equity
$1,545,704
Purchase Details
Closed on
Jan 16, 1997
Sold by
Geisberg Samuel P and Geisberg Mira
Bought by
Jacques Cheryl A
Home Financials for this Owner
Home Financials are based on the most recent Mortgage that was taken out on this home.
Original Mortgage
$201,920
Interest Rate
7.36%
Mortgage Type
Purchase Money Mortgage
Create a Home Valuation Report for This Property
The Home Valuation Report is an in-depth analysis detailing your home's value as well as a comparison with similar homes in the area
Home Values in the Area
Average Home Value in this Area
Purchase History
| Date | Buyer | Sale Price | Title Company |
|---|---|---|---|
| Tsung Eushiuan T | $453,000 | -- | |
| Tsung Eushiuan T | $453,000 | -- | |
| Jacques Cheryl A | $252,400 | -- | |
| Jacques Cheryl A | $252,400 | -- |
Source: Public Records
Mortgage History
| Date | Status | Borrower | Loan Amount |
|---|---|---|---|
| Open | Tsung Eushiuan T | $300,700 | |
| Closed | Jacques Cheryl A | $300,700 | |
| Previous Owner | Jacques Cheryl A | $201,920 |
Source: Public Records
Tax History
| Year | Tax Paid | Tax Assessment Tax Assessment Total Assessment is a certain percentage of the fair market value that is determined by local assessors to be the total taxable value of land and additions on the property. | Land | Improvement |
|---|---|---|---|---|
| 2025 | $17,771 | $1,676,500 | $803,300 | $873,200 |
| 2024 | $17,900 | $1,429,700 | $591,200 | $838,500 |
| 2023 | $16,593 | $1,272,500 | $591,200 | $681,300 |
| 2022 | $15,611 | $1,167,600 | $523,400 | $644,200 |
| 2021 | $15,214 | $1,167,600 | $523,400 | $644,200 |
| 2020 | $14,492 | $1,160,300 | $523,400 | $636,900 |
| 2019 | $13,888 | $1,120,900 | $476,000 | $644,900 |
| 2018 | $13,316 | $1,120,900 | $476,000 | $644,900 |
| 2016 | $7,364 | $638,100 | $476,000 | $162,100 |
| 2015 | $7,204 | $638,100 | $476,000 | $162,100 |
| 2014 | $6,450 | $554,100 | $397,000 | $157,100 |
Source: Public Records
Map
Nearby Homes
- 176 Highgate St
- 31 Birds Hill Ave
- 68 Brookline St
- 190 Brookline St
- 126 Prince St
- 17 Lindbergh Ave
- 36 Otis St Unit 36
- 883 Greendale Ave
- 60 Douglas Rd
- 638 Webster St
- 638 Webster St Unit 638
- 28 Green St
- 100 Bradford St
- 510 Webster St
- 971 Webster St
- 19 Oakland Ave Unit 19
- 60 Sutton Rd
- 19 Highland Ct Unit 19
- 1011 Webster St
- 68 Pleasant St Unit 68
- 70 Helen Rd
- 58 Helen Rd
- 30 Morningside Rd
- 36 Morningside Rd
- 24 Morningside Rd
- 67 Helen Rd
- 128 Aletha Rd
- 74 Helen Rd
- 53 Helen Rd
- 44 Morningside Rd
- 124 Aletha Rd
- 14 Morningside Rd
- 133 Aletha Rd
- 27 Morningside Rd
- 172 Highgate St
- 152 Highgate St
- 33 Morningside Rd
- 43 Helen Rd
- 21 Morningside Rd
- 118 Aletha Rd
Your Personal Tour Guide
Ask me questions while you tour the home.