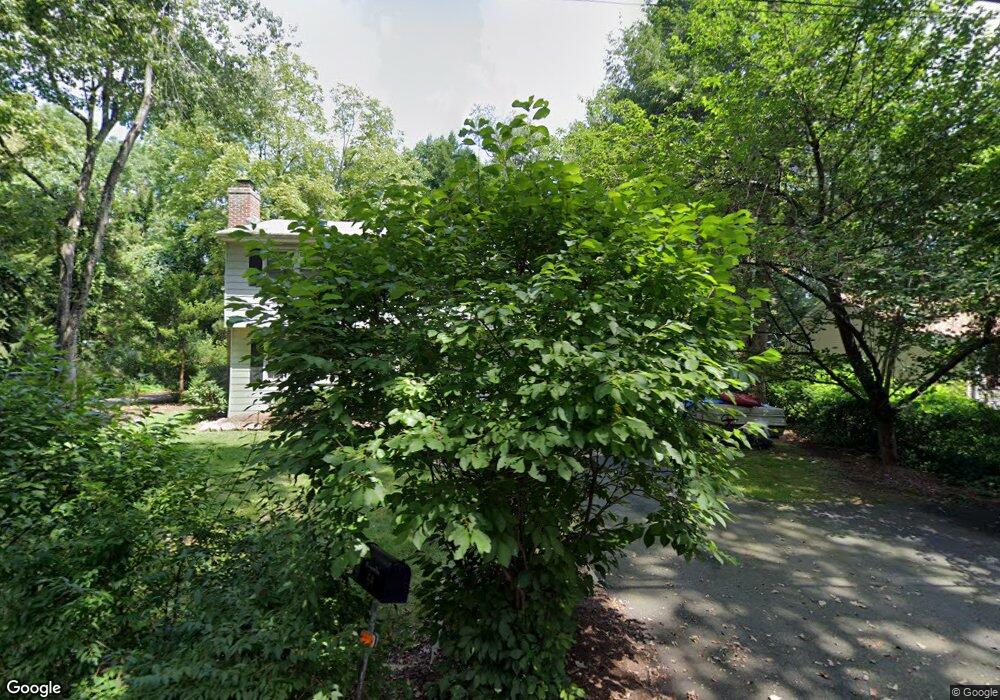
64 Hemlock St Oakland, NJ 07436
Estimated Value: $551,090 - $684,000
--
Bed
--
Bath
1,910
Sq Ft
$324/Sq Ft
Est. Value
About This Home
This home is located at 64 Hemlock St, Oakland, NJ 07436 and is currently estimated at $619,273, approximately $324 per square foot. 64 Hemlock St is a home located in Bergen County with nearby schools including Dogwood Hill Elementary School, Valley Middle School, and Indian Hills High School.
Ownership History
Date
Name
Owned For
Owner Type
Purchase Details
Closed on
Nov 21, 2002
Sold by
Rumpeltin Jon
Bought by
Rumpeltin Denise
Current Estimated Value
Home Financials for this Owner
Home Financials are based on the most recent Mortgage that was taken out on this home.
Original Mortgage
$195,000
Outstanding Balance
$82,518
Interest Rate
6.16%
Estimated Equity
$536,755
Purchase Details
Closed on
Sep 21, 2000
Bought by
Rumpeltin Denise M
Home Financials for this Owner
Home Financials are based on the most recent Mortgage that was taken out on this home.
Original Mortgage
$30,929
Interest Rate
7.76%
Purchase Details
Closed on
Jun 27, 1996
Sold by
Young Richard and Young Donna
Bought by
Rumpeltin Jonn and Rumpeltin Denise
Home Financials for this Owner
Home Financials are based on the most recent Mortgage that was taken out on this home.
Original Mortgage
$163,000
Interest Rate
8.05%
Create a Home Valuation Report for This Property
The Home Valuation Report is an in-depth analysis detailing your home's value as well as a comparison with similar homes in the area
Home Values in the Area
Average Home Value in this Area
Purchase History
| Date | Buyer | Sale Price | Title Company |
|---|---|---|---|
| Rumpeltin Denise | -- | -- | |
| Rumpeltin Denise M | -- | -- | |
| Rumpeltin Denise M | -- | -- | |
| Rumpeltin Jonn | $172,000 | -- |
Source: Public Records
Mortgage History
| Date | Status | Borrower | Loan Amount |
|---|---|---|---|
| Open | Rumpeltin Denise | $195,000 | |
| Previous Owner | Rumpeltin Denise M | $30,929 | |
| Previous Owner | Rumpeltin Jonn | $163,000 |
Source: Public Records
Tax History Compared to Growth
Tax History
| Year | Tax Paid | Tax Assessment Tax Assessment Total Assessment is a certain percentage of the fair market value that is determined by local assessors to be the total taxable value of land and additions on the property. | Land | Improvement |
|---|---|---|---|---|
| 2025 | $8,439 | $394,000 | $215,600 | $178,400 |
| 2024 | $9,282 | $366,900 | $196,100 | $170,800 |
| 2023 | $8,978 | $391,000 | $183,300 | $207,700 |
| 2022 | $8,978 | $381,700 | $178,400 | $203,300 |
| 2021 | $9,938 | $346,700 | $162,900 | $183,800 |
| 2020 | $10,398 | $346,700 | $162,900 | $183,800 |
| 2019 | $10,034 | $346,700 | $162,900 | $183,800 |
| 2018 | $9,822 | $346,700 | $162,900 | $183,800 |
| 2017 | $9,694 | $346,700 | $162,900 | $183,800 |
| 2016 | $9,430 | $346,700 | $162,900 | $183,800 |
| 2015 | $9,243 | $346,700 | $162,900 | $183,800 |
| 2014 | $9,052 | $346,700 | $162,900 | $183,800 |
Source: Public Records
Map
Nearby Homes