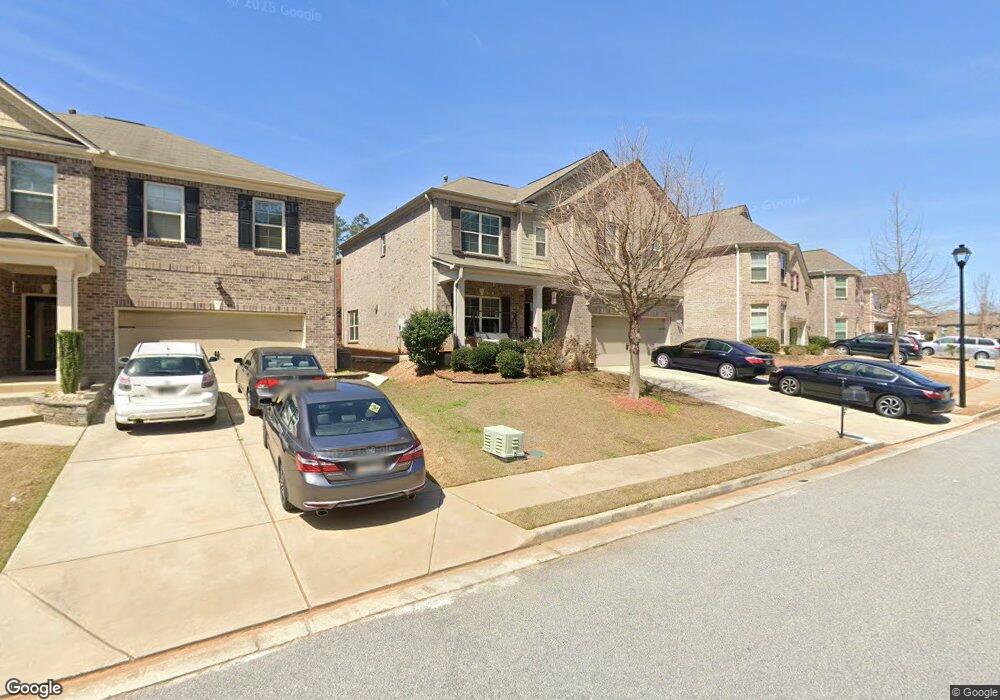
64 Kent Valley Cir Tucker, GA 30084
Estimated Value: $493,614 - $602,000
5
Beds
4
Baths
2,647
Sq Ft
$210/Sq Ft
Est. Value
About This Home
This home is located at 64 Kent Valley Cir, Tucker, GA 30084 and is currently estimated at $554,654, approximately $209 per square foot. 64 Kent Valley Cir is a home with nearby schools including Arcado Elementary School, Trickum Middle School, and Parkview High School.
Ownership History
Date
Name
Owned For
Owner Type
Purchase Details
Closed on
Nov 10, 2017
Sold by
Samshuddin Soheb
Bought by
Samshuddin Soheb and Alifia Virani
Current Estimated Value
Purchase Details
Closed on
Mar 11, 2016
Sold by
Singh Khushwinder
Bought by
Samshuddin Soheb
Purchase Details
Closed on
Apr 10, 2014
Sold by
Singh Khushwinder
Bought by
Singh Khushwinder and Samsuddin Shabnam
Purchase Details
Closed on
Feb 3, 2014
Sold by
Samsuddin Shabnam
Bought by
Singh Khushwinder
Purchase Details
Closed on
Sep 25, 2013
Sold by
Ryland Grp Inc
Bought by
Samsuddin Shabnam
Home Financials for this Owner
Home Financials are based on the most recent Mortgage that was taken out on this home.
Original Mortgage
$228,135
Interest Rate
4.53%
Mortgage Type
New Conventional
Purchase Details
Closed on
Jun 5, 2013
Sold by
Piedmont Investments 2 Llc
Bought by
Ryland Grp Inc
Create a Home Valuation Report for This Property
The Home Valuation Report is an in-depth analysis detailing your home's value as well as a comparison with similar homes in the area
Home Values in the Area
Average Home Value in this Area
Purchase History
| Date | Buyer | Sale Price | Title Company |
|---|---|---|---|
| Samshuddin Soheb | -- | -- | |
| Samshuddin Soheb | -- | -- | |
| Singh Khushwinder | -- | -- | |
| Singh Khushwinder | -- | -- | |
| Samsuddin Shabnam | $253,485 | -- | |
| Ryland Grp Inc | $846,000 | -- |
Source: Public Records
Mortgage History
| Date | Status | Borrower | Loan Amount |
|---|---|---|---|
| Previous Owner | Samsuddin Shabnam | $228,135 |
Source: Public Records
Tax History Compared to Growth
Tax History
| Year | Tax Paid | Tax Assessment Tax Assessment Total Assessment is a certain percentage of the fair market value that is determined by local assessors to be the total taxable value of land and additions on the property. | Land | Improvement |
|---|---|---|---|---|
| 2025 | $7,860 | $213,600 | $36,000 | $177,600 |
| 2024 | $7,995 | $215,080 | $36,000 | $179,080 |
| 2023 | $7,995 | $175,720 | $36,000 | $139,720 |
| 2022 | $6,543 | $175,720 | $36,000 | $139,720 |
| 2021 | $5,203 | $135,720 | $26,800 | $108,920 |
| 2020 | $5,235 | $135,720 | $26,800 | $108,920 |
| 2019 | $5,041 | $135,720 | $26,800 | $108,920 |
| 2018 | $4,563 | $121,840 | $22,400 | $99,440 |
| 2016 | $4,251 | $112,960 | $18,400 | $94,560 |
| 2015 | $3,857 | $100,440 | $18,400 | $82,040 |
| 2014 | -- | $100,440 | $18,400 | $82,040 |
Source: Public Records
Map
Nearby Homes
- 29 Lankford Rd
- 5887 Stow Dr
- 5796 Princeton Run Trail
- 5806 Princeton Run Trail
- 127 Old Rosser Rd SW
- 5798 Lost Grove Dr NW
- 5817 Lost Grove Dr NW Unit 2
- 5768 Lost Grove Dr NW
- 292 Old Rosser Rd
- 5762 Renee Ct NW
- 6139 Wayburn St
- 6156 Thorncrest Dr
- 127 Roe Hampton Ln
- 3443 Hillyard Dr
- 6133 Wayburn St
- 327 Dresden Cir
- 74 Kent Valley Cir
- 54 Kent Valley Cir
- 44 Kent Valley Cir
- 324 Kent Valley Cir
- 334 Kent Valley Cir
- 84 Kent Valley Cir
- 314 Kent Valley Cir
- 344 Kent Valley Cir
- 61 Kent Valley Cir
- 51 Kent Valley Cir
- 34 Kent Valley Cir
- 41 Kent Valley Cir
- 94 Kent Valley Cir
- 354 Kent Valley Cir
- 304 Kent Valley Cir
- 31 Kent Valley Cir
- 14 Kent Valley Cir
- 0 Kent Valley Cir Unit 7382006
- 0 Kent Valley Cir Unit 7419595
- 0 Kent Valley Cir Unit 3017995