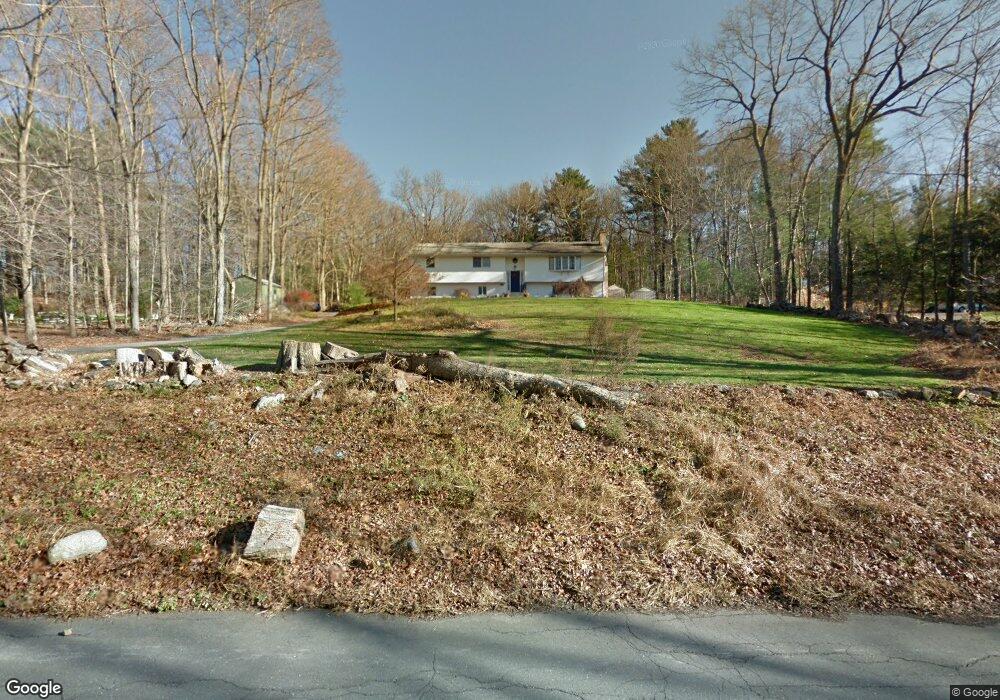
64 Lacey Rd Bethany, CT 06524
Estimated Value: $496,793 - $567,000
4
Beds
3
Baths
1,668
Sq Ft
$324/Sq Ft
Est. Value
About This Home
This home is located at 64 Lacey Rd, Bethany, CT 06524 and is currently estimated at $539,948, approximately $323 per square foot. 64 Lacey Rd is a home located in New Haven County with nearby schools including Bethany Community School.
Ownership History
Date
Name
Owned For
Owner Type
Purchase Details
Closed on
May 29, 2020
Sold by
Benciverngo John P
Bought by
Bencivengo Margaret A
Current Estimated Value
Purchase Details
Closed on
Nov 5, 1996
Sold by
Amadeo Dolores
Bought by
Bencivengo John P and Bencivengo Margaret A
Create a Home Valuation Report for This Property
The Home Valuation Report is an in-depth analysis detailing your home's value as well as a comparison with similar homes in the area
Home Values in the Area
Average Home Value in this Area
Purchase History
| Date | Buyer | Sale Price | Title Company |
|---|---|---|---|
| Bencivengo Margaret A | -- | None Available | |
| Bencivengo Margaret A | -- | None Available | |
| Bencivengo John P | $138,500 | -- | |
| Bencivengo John P | $138,500 | -- |
Source: Public Records
Mortgage History
| Date | Status | Borrower | Loan Amount |
|---|---|---|---|
| Previous Owner | Bencivengo John P | $150,000 | |
| Previous Owner | Bencivengo John P | $65,748 |
Source: Public Records
Tax History
| Year | Tax Paid | Tax Assessment Tax Assessment Total Assessment is a certain percentage of the fair market value that is determined by local assessors to be the total taxable value of land and additions on the property. | Land | Improvement |
|---|---|---|---|---|
| 2025 | $8,220 | $282,100 | $76,860 | $205,240 |
| 2024 | $8,017 | $282,100 | $76,860 | $205,240 |
| 2023 | $8,367 | $221,470 | $85,400 | $136,070 |
| 2022 | $7,973 | $221,470 | $85,400 | $136,070 |
| 2021 | $7,641 | $221,470 | $85,400 | $136,070 |
| 2020 | $8,097 | $221,470 | $85,400 | $136,070 |
| 2019 | $8,401 | $227,670 | $85,400 | $142,270 |
| 2018 | $8,386 | $227,250 | $95,190 | $132,060 |
| 2017 | $8,386 | $227,250 | $95,190 | $132,060 |
| 2016 | $8,067 | $227,250 | $95,190 | $132,060 |
| 2015 | $7,963 | $227,250 | $95,190 | $132,060 |
| 2014 | $7,704 | $227,250 | $95,190 | $132,060 |
Source: Public Records
Map
Nearby Homes
- 1070 Amity Rd Unit LOT 36
- 61 Edwards Rd
- 1144 Amity Rd
- 55 Trout Brook Dr
- Lot 4 Coachlight Cir
- lot3 Coachlight Cir Unit 3
- 108 Clark Rd Unit TRLR 10
- 39 Horton Hill Rd Unit 7C
- 39 Horton Hill Rd Unit 10I
- 1405 New Haven Rd
- 340 Wooding Hill Rd
- Lot #9 Morning Dove Rd Unit Lot 9
- Lot 9II Morning Dove Rd
- 11 Old Fairwood Road Extension
- 81 Mountain Rd
- 77 Meadow Lark Rd
- 935 Gaylord Mountain Rd
- 93 Tawny Thrush Rd
- 11 Nature Trail
- 39 Fawn Meadow Dr
Your Personal Tour Guide
Ask me questions while you tour the home.