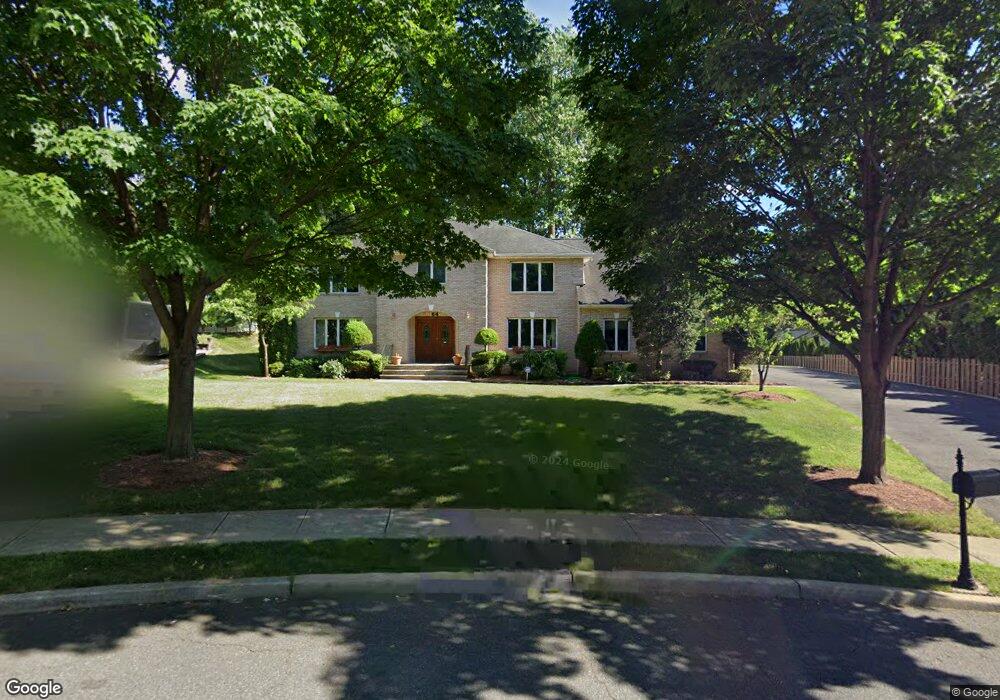
64 Lilac Ln Paramus, NJ 07652
Estimated Value: $1,586,092 - $1,845,000
Studio
--
Bath
3,640
Sq Ft
$474/Sq Ft
Est. Value
About This Home
This home is located at 64 Lilac Ln, Paramus, NJ 07652 and is currently estimated at $1,724,773, approximately $473 per square foot. 64 Lilac Ln is a home located in Bergen County with nearby schools including Paramus High School, Ben Porat Yosef, and St. Peter Academy.
Ownership History
Date
Name
Owned For
Owner Type
Purchase Details
Closed on
May 23, 2022
Sold by
Jin Yoon Jae and Yang Seunghwa
Bought by
Hong Eric and Hong Dasle
Current Estimated Value
Home Financials for this Owner
Home Financials are based on the most recent Mortgage that was taken out on this home.
Original Mortgage
$984,000
Outstanding Balance
$935,195
Interest Rate
5.3%
Mortgage Type
Balloon
Estimated Equity
$789,578
Purchase Details
Closed on
Nov 6, 1998
Sold by
Howland Forest Inc
Bought by
Yoon Jae Jin and Yoon Seunghwa
Create a Home Valuation Report for This Property
The Home Valuation Report is an in-depth analysis detailing your home's value as well as a comparison with similar homes in the area
Home Values in the Area
Average Home Value in this Area
Purchase History
| Date | Buyer | Sale Price | Title Company |
|---|---|---|---|
| Hong Eric | $1,230,000 | Blueland Title | |
| Yoon Jae Jin | $482,500 | -- |
Source: Public Records
Mortgage History
| Date | Status | Borrower | Loan Amount |
|---|---|---|---|
| Open | Hong Eric | $984,000 |
Source: Public Records
Tax History
| Year | Tax Paid | Tax Assessment Tax Assessment Total Assessment is a certain percentage of the fair market value that is determined by local assessors to be the total taxable value of land and additions on the property. | Land | Improvement |
|---|---|---|---|---|
| 2025 | $18,780 | $1,310,100 | $449,700 | $860,400 |
| 2024 | $18,262 | $1,240,400 | $416,100 | $824,300 |
| 2023 | $17,337 | $1,190,500 | $396,100 | $794,400 |
| 2022 | $17,337 | $1,117,100 | $369,600 | $747,500 |
| 2021 | $17,011 | $1,028,500 | $341,000 | $687,500 |
| 2020 | $16,169 | $1,013,700 | $336,000 | $677,700 |
| 2019 | $16,526 | $890,400 | $384,400 | $506,000 |
| 2018 | $16,321 | $890,400 | $384,400 | $506,000 |
| 2017 | $16,036 | $890,400 | $384,400 | $506,000 |
| 2016 | $15,600 | $890,400 | $384,400 | $506,000 |
| 2015 | $15,440 | $876,500 | $384,400 | $492,100 |
| 2014 | $15,067 | $876,500 | $384,400 | $492,100 |
Source: Public Records
Map
Nearby Homes
- 187 Brookfield Ave
- 81 Eastbrook Dr
- 16 Coles Ct
- 46 Knollwood Dr
- 122 Village Cir E
- 127 Village Cir E
- 175 Valley Rd
- 302 Howland Ave
- 285 Wayne Ave
- 374 Valley Rd
- 205 Davis Ave
- 254 W Spring Valley Ave
- 857 Collingwood Ave
- 189 Forest Ave Unit 117
- 189 Forest Ave Unit 409
- 181 Allen St
- 149 Allen St
- 824 Summit Ave
- 262 Spring Valley Ave
- 219 Sanzari Place
Your Personal Tour Guide
Ask me questions while you tour the home.