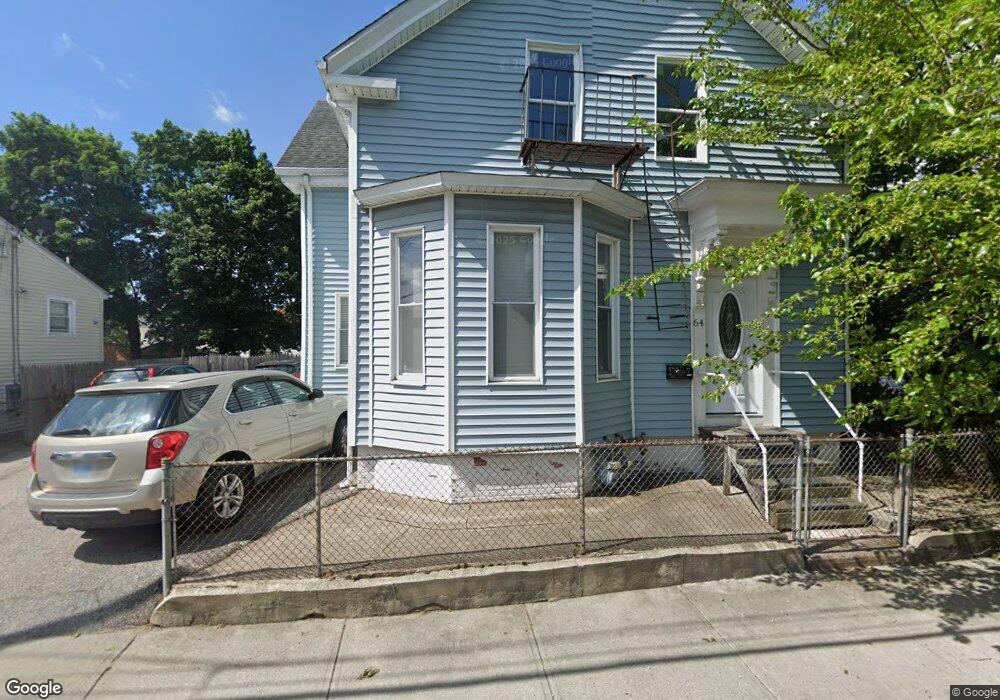
64 Lowell Ave Providence, RI 02909
Silver Lake NeighborhoodEstimated Value: $449,512 - $591,000
6
Beds
2
Baths
1,966
Sq Ft
$261/Sq Ft
Est. Value
About This Home
This home is located at 64 Lowell Ave, Providence, RI 02909 and is currently estimated at $513,128, approximately $261 per square foot. 64 Lowell Ave is a home located in Providence County with nearby schools including Charles N. Fortes Elementary School, Asa Messer Elementary School, and Laurel Hill Annex School.
Ownership History
Date
Name
Owned For
Owner Type
Purchase Details
Closed on
Jul 17, 2014
Sold by
Mendez Dominga and Mendez Didier
Bought by
Mendez Didier
Current Estimated Value
Purchase Details
Closed on
Apr 23, 2010
Sold by
Mendez Dominga
Bought by
Mendez Dominga and Mendez Didier
Home Financials for this Owner
Home Financials are based on the most recent Mortgage that was taken out on this home.
Original Mortgage
$2,500
Interest Rate
5.13%
Purchase Details
Closed on
Feb 19, 2010
Sold by
Reservoir Ventures 2 L
Bought by
Mendez Dominga
Purchase Details
Closed on
May 21, 2009
Sold by
Ne Properties
Bought by
Reservoir Venture 2 Ll
Purchase Details
Closed on
Dec 15, 2005
Sold by
Bolanos Edwin
Bought by
Bolanos Stephen
Purchase Details
Closed on
Dec 9, 1988
Sold by
Weston Anthony
Bought by
Bolanos Edwin
Create a Home Valuation Report for This Property
The Home Valuation Report is an in-depth analysis detailing your home's value as well as a comparison with similar homes in the area
Home Values in the Area
Average Home Value in this Area
Purchase History
| Date | Buyer | Sale Price | Title Company |
|---|---|---|---|
| Mendez Didier | -- | -- | |
| Mendez Dominga | -- | -- | |
| Mendez Dominga | $160,000 | -- | |
| Reservoir Venture 2 Ll | $43,000 | -- | |
| Ne Properties Inc | $39,500 | -- | |
| Bolanos Stephen | $275,000 | -- | |
| Bolanos Edwin | $106,000 | -- | |
| Bolanos Edwin | $106,000 | -- |
Source: Public Records
Mortgage History
| Date | Status | Borrower | Loan Amount |
|---|---|---|---|
| Previous Owner | Bolanos Edwin | $154,163 | |
| Previous Owner | Bolanos Edwin | $2,500 |
Source: Public Records
Tax History Compared to Growth
Tax History
| Year | Tax Paid | Tax Assessment Tax Assessment Total Assessment is a certain percentage of the fair market value that is determined by local assessors to be the total taxable value of land and additions on the property. | Land | Improvement |
|---|---|---|---|---|
| 2025 | $6,007 | $429,100 | $128,000 | $301,100 |
| 2024 | $5,314 | $289,600 | $72,000 | $217,600 |
| 2023 | $5,314 | $289,600 | $72,000 | $217,600 |
| 2022 | $5,155 | $289,600 | $72,000 | $217,600 |
| 2021 | $4,745 | $193,200 | $45,800 | $147,400 |
| 2020 | $4,745 | $193,200 | $45,800 | $147,400 |
| 2019 | $4,745 | $193,200 | $45,800 | $147,400 |
| 2018 | $4,331 | $135,500 | $44,400 | $91,100 |
| 2017 | $4,331 | $135,500 | $44,400 | $91,100 |
| 2016 | $4,331 | $135,500 | $44,400 | $91,100 |
| 2015 | $3,714 | $112,200 | $47,100 | $65,100 |
| 2014 | $3,787 | $112,200 | $47,100 | $65,100 |
| 2013 | $3,787 | $112,200 | $47,100 | $65,100 |
Source: Public Records
Map
Nearby Homes
- 144 Daniel Ave
- 663 Plainfield St
- 20 Magdalene St
- 27 Moorefield St
- 64 Ralph St
- 36 Moorefield St Unit 38
- 665 Plainfield St
- 47 Alverson Ave
- 649 Union Ave
- 240 Eastwood Ave
- 27 What Cheer Ave
- 41 Terrace Ave
- 20 Dewey St
- 776 Plainfield St
- 26 Alto St
- 231 Lowell Ave
- 75 Prudence Ave
- 14 Shafter St
- 355 Laurel Hill Ave
- 161 Prudence Ave