
Seller's Agent in 2026
Kimberly Kearns-Nardone
Kearns Nardone Realty LLC
(978) 758-1425
3 in this area
100 Total Sales
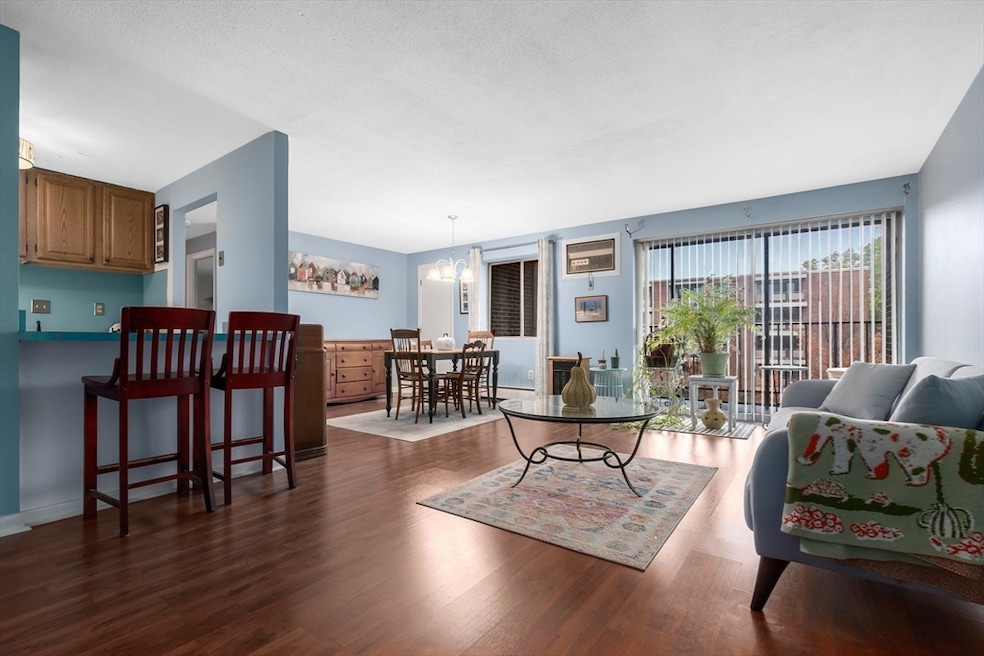
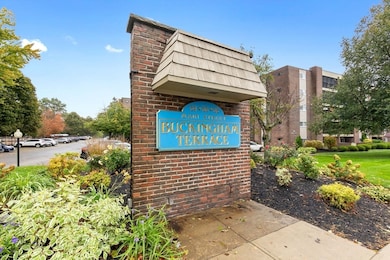
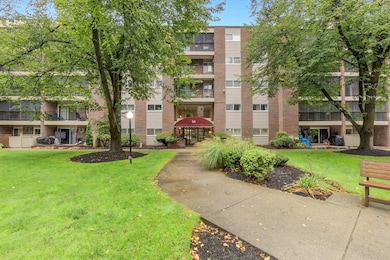
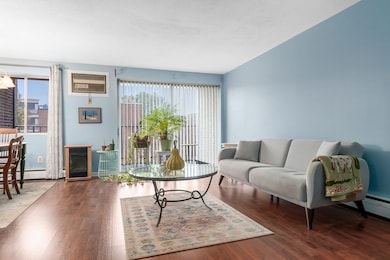

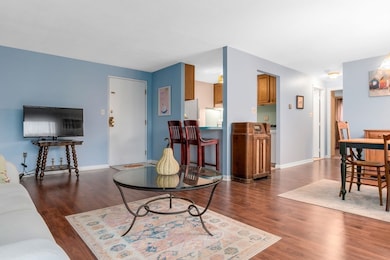
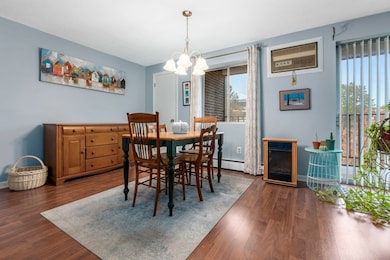
RARELY AVAILABLE CORNER UNIT!!! Bright, inviting, and move-in ready, this two-bedroom, one-bath condo in the highly sought-after Buckingham Terrace combines comfort and convenience. The open-concept living and dining areas create a seamless flow, perfect for entertaining or relaxing at home. Both generously sized bedrooms are flooded with natural light and boast impressive closet space, making organization effortless. Enjoy your private balcony, ideal for morning coffee, evening sunsets, or just unwinding after a long day. The unit’s additional storage closet provides ample space for all your belongings. Residents benefit from desirable amenities including an in-ground pool, in-building laundry, exterior maintenance, landscaping, snow removal, and a deeded parking spot. Perfectly situated near Redstone Shopping Plaza, Bear Hill Golf Course, and Stoneham’s vibrant shops and restaurants, with easy access to I-93, I-95, and public transportation.
Last Agent to Sell the Property
Kearns Nardone Realty LLC Listed on: 10/15/2025
| Date | Type | Sale Price | Title Company |
|---|---|---|---|
| Quit Claim Deed | $377,500 | -- | |
| Deed | $245,000 | -- | |
| Deed | $104,900 | -- | |
| Deed | $104,900 | -- | |
| Deed | $97,000 | -- | |
| Deed | $97,000 | -- | |
| Deed | $97,000 | -- | |
| Deed | $97,000 | -- |
| Date | Status | Loan Amount | Loan Type |
|---|---|---|---|
| Open | $362,500 | Purchase Money Mortgage | |
| Previous Owner | $196,000 | Purchase Money Mortgage | |
| Previous Owner | $54,000 | Purchase Money Mortgage | |
| Previous Owner | $89,350 | Purchase Money Mortgage |
| Date | Event | Price | List to Sale | Price per Sq Ft |
|---|---|---|---|---|
| 02/24/2026 02/24/26 | Sold | $377,500 | -1.9% | $409 / Sq Ft |
| 12/11/2025 12/11/25 | Pending | -- | -- | -- |
| 11/12/2025 11/12/25 | Price Changed | $384,900 | -1.1% | $417 / Sq Ft |
| 10/30/2025 10/30/25 | Price Changed | $389,000 | -2.5% | $422 / Sq Ft |
| 10/15/2025 10/15/25 | For Sale | $399,000 | -- | $433 / Sq Ft |
| Year | Tax Paid | Tax Assessment Tax Assessment Total Assessment is a certain percentage of the fair market value that is determined by local assessors to be the total taxable value of land and additions on the property. | Land | Improvement |
|---|---|---|---|---|
| 2025 | $3,559 | $347,900 | $0 | $347,900 |
| 2024 | $3,556 | $335,800 | $0 | $335,800 |
| 2023 | $3,374 | $304,000 | $0 | $304,000 |
| 2022 | $2,944 | $282,800 | $0 | $282,800 |
| 2021 | $2,965 | $274,000 | $0 | $274,000 |
| 2020 | $2,796 | $259,100 | $0 | $259,100 |
| 2019 | $2,758 | $245,800 | $0 | $245,800 |
| 2018 | $2,580 | $220,300 | $0 | $220,300 |
| 2017 | $2,337 | $188,600 | $0 | $188,600 |
| 2016 | $2,342 | $184,400 | $0 | $184,400 |
| 2015 | $2,159 | $166,600 | $0 | $166,600 |
| 2014 | $2,175 | $161,200 | $0 | $161,200 |
Seller's Agent in 2026
Kimberly Kearns-Nardone
Kearns Nardone Realty LLC
(978) 758-1425
3 in this area
100 Total Sales
V
Seller Co-Listing Agent in 2026
Vanessa Palmieri
Kearns Nardone Realty LLC
2 in this area
27 Total Sales
Buyer's Agent in 2026
Lara Chankhour
Coldwell Banker Realty - Lynnfield
(781) 854-1754
1 in this area
3 Total Sales
Source: MLS Property Information Network (MLS PIN)
MLS Number: 73444226
APN: STON-000011-000000-000041B
Disclaimer: Certain information contained herein is derived from information provided by parties other than Homes.com. All information provided is deemed reliable, but is not guaranteed to be accurate and should be independently verified.
![]() The property listing data and information, or the Images, set forth herein were provided to MLS Property Information Network, Inc. from third party sources, including sellers, lessors and public records, and were compiled by MLS Property Information Network, Inc. The property listing data and information, and the Images, are for the personal, non-commercial use of consumers having a good faith interest in purchasing or leasing listed properties of the type displayed to them and may not be used for any purpose other than to identify prospective properties which such consumers may have a good faith interest in purchasing or leasing. MLS Property Information Network, Inc. and its subscribers disclaim any and all representations and warranties as to the accuracy of the property listing data and information, or as to the accuracy of any of the Images, set forth herein.
The property listing data and information, or the Images, set forth herein were provided to MLS Property Information Network, Inc. from third party sources, including sellers, lessors and public records, and were compiled by MLS Property Information Network, Inc. The property listing data and information, and the Images, are for the personal, non-commercial use of consumers having a good faith interest in purchasing or leasing listed properties of the type displayed to them and may not be used for any purpose other than to identify prospective properties which such consumers may have a good faith interest in purchasing or leasing. MLS Property Information Network, Inc. and its subscribers disclaim any and all representations and warranties as to the accuracy of the property listing data and information, or as to the accuracy of any of the Images, set forth herein.
Ask me questions while you tour the home.