Estimated Value: $216,000 - $254,909
6
Beds
2
Baths
2,128
Sq Ft
$111/Sq Ft
Est. Value
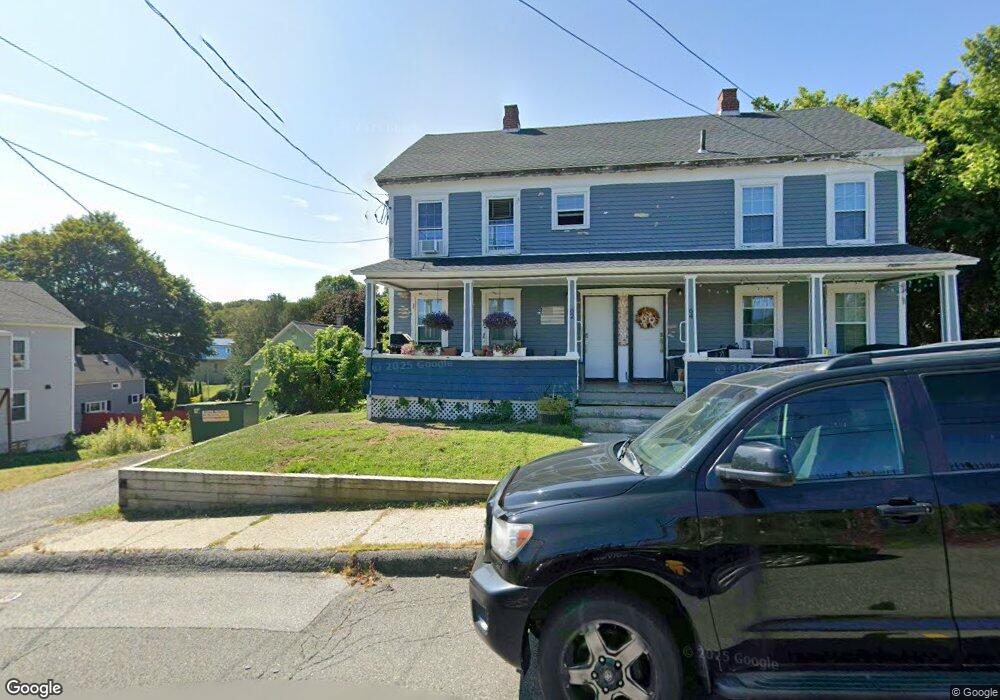
About This Home
This home is located at 64 Maple St, Adams, MA 01220 and is currently estimated at $236,727, approximately $111 per square foot. 64 Maple St is a home located in Berkshire County with nearby schools including Hoosac Valley Middle & High School, Berkshire Arts & Technology Charter Public School, and St. Stanislaus Kostka School.
Ownership History
Date
Name
Owned For
Owner Type
Purchase Details
Closed on
Dec 9, 2016
Sold by
Jane E Conniff Lt
Bought by
Bresett Mitchell J
Current Estimated Value
Home Financials for this Owner
Home Financials are based on the most recent Mortgage that was taken out on this home.
Original Mortgage
$68,000
Outstanding Balance
$45,370
Interest Rate
3.47%
Mortgage Type
New Conventional
Estimated Equity
$191,357
Purchase Details
Closed on
Sep 28, 2011
Sold by
Conniff Jane E and Conniff Donald O
Bought by
Conniff Jane E
Create a Home Valuation Report for This Property
The Home Valuation Report is an in-depth analysis detailing your home's value as well as a comparison with similar homes in the area
Home Values in the Area
Average Home Value in this Area
Purchase History
| Date | Buyer | Sale Price | Title Company |
|---|---|---|---|
| Bresett Mitchell J | $40,000 | -- | |
| Conniff Jane E | -- | -- |
Source: Public Records
Mortgage History
| Date | Status | Borrower | Loan Amount |
|---|---|---|---|
| Open | Bresett Mitchell J | $68,000 |
Source: Public Records
Tax History
| Year | Tax Paid | Tax Assessment Tax Assessment Total Assessment is a certain percentage of the fair market value that is determined by local assessors to be the total taxable value of land and additions on the property. | Land | Improvement |
|---|---|---|---|---|
| 2025 | $2,744 | $161,300 | $52,100 | $109,200 |
| 2024 | $2,596 | $148,000 | $48,900 | $99,100 |
| 2023 | $2,441 | $131,600 | $44,500 | $87,100 |
| 2022 | $2,394 | $114,600 | $38,700 | $75,900 |
| 2021 | $2,520 | $111,400 | $38,700 | $72,700 |
| 2020 | $2,387 | $109,100 | $38,700 | $70,400 |
| 2019 | $2,334 | $109,100 | $38,700 | $70,400 |
| 2018 | $2,392 | $107,700 | $38,700 | $69,000 |
| 2017 | $2,302 | $107,700 | $38,700 | $69,000 |
| 2016 | $2,492 | $116,500 | $38,700 | $77,800 |
| 2015 | $2,447 | $114,500 | $40,500 | $74,000 |
| 2014 | $2,284 | $114,500 | $40,500 | $74,000 |
Source: Public Records
Map
Nearby Homes
Your Personal Tour Guide
Ask me questions while you tour the home.