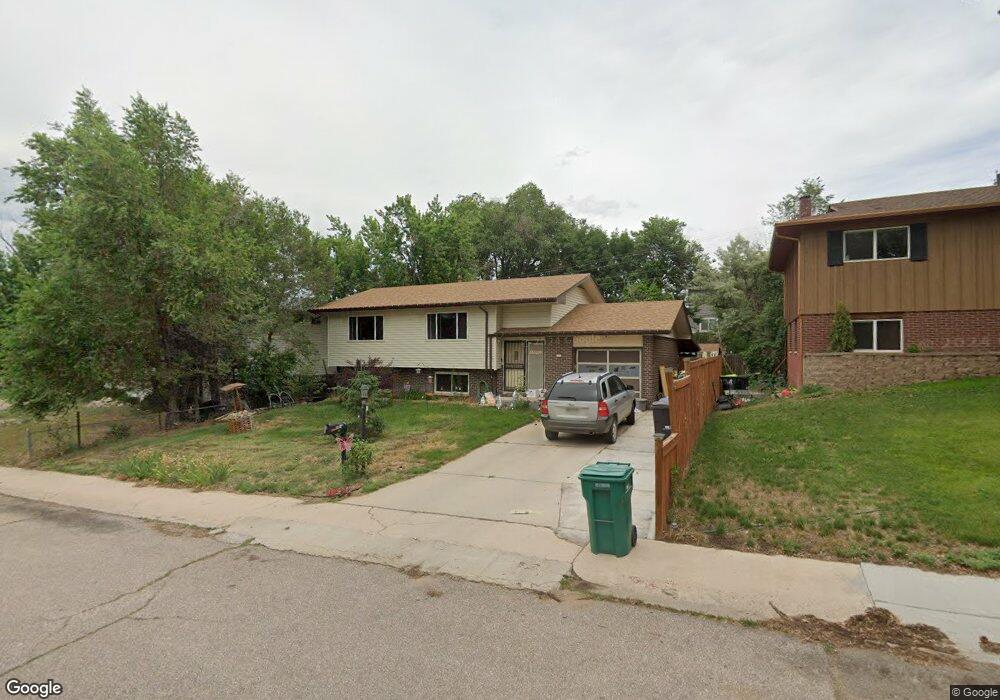
64 Mcburney Blvd Colorado Springs, CO 80911
Fountain Valley Ranch NeighborhoodEstimated Value: $306,224 - $346,000
3
Beds
2
Baths
868
Sq Ft
$387/Sq Ft
Est. Value
About This Home
This home is located at 64 Mcburney Blvd, Colorado Springs, CO 80911 and is currently estimated at $335,806, approximately $386 per square foot. 64 Mcburney Blvd is a home located in El Paso County with nearby schools including Venetucci Elementary School, Watson Junior High School, and Widefield High School.
Ownership History
Date
Name
Owned For
Owner Type
Purchase Details
Closed on
Sep 9, 2009
Sold by
Rust Steven J
Bought by
Kraft John J and Kraft Kerry L
Current Estimated Value
Home Financials for this Owner
Home Financials are based on the most recent Mortgage that was taken out on this home.
Original Mortgage
$138,668
Outstanding Balance
$91,010
Interest Rate
5.26%
Mortgage Type
VA
Estimated Equity
$244,796
Create a Home Valuation Report for This Property
The Home Valuation Report is an in-depth analysis detailing your home's value as well as a comparison with similar homes in the area
Home Values in the Area
Average Home Value in this Area
Purchase History
| Date | Buyer | Sale Price | Title Company |
|---|---|---|---|
| Kraft John J | $135,750 | Stewart Title |
Source: Public Records
Mortgage History
| Date | Status | Borrower | Loan Amount |
|---|---|---|---|
| Open | Kraft John J | $138,668 |
Source: Public Records
Tax History Compared to Growth
Tax History
| Year | Tax Paid | Tax Assessment Tax Assessment Total Assessment is a certain percentage of the fair market value that is determined by local assessors to be the total taxable value of land and additions on the property. | Land | Improvement |
|---|---|---|---|---|
| 2025 | $1,394 | $23,700 | -- | -- |
| 2024 | $1,332 | $23,690 | $4,020 | $19,670 |
| 2023 | $1,332 | $23,690 | $4,020 | $19,670 |
| 2022 | $1,179 | $16,910 | $2,780 | $14,130 |
| 2021 | $1,276 | $17,400 | $2,860 | $14,540 |
| 2020 | $903 | $12,070 | $2,500 | $9,570 |
| 2019 | $897 | $12,070 | $2,500 | $9,570 |
| 2018 | $810 | $10,210 | $1,870 | $8,340 |
| 2017 | $819 | $10,210 | $1,870 | $8,340 |
| 2016 | $683 | $10,590 | $1,990 | $8,600 |
| 2015 | $703 | $10,590 | $1,990 | $8,600 |
| 2014 | $654 | $9,950 | $1,790 | $8,160 |
Source: Public Records
Map
Nearby Homes