64 N Cary St Brockton, MA 02302
Estimated Value: $455,000 - $536,000
3
Beds
1
Bath
1,344
Sq Ft
$369/Sq Ft
Est. Value
About This Home
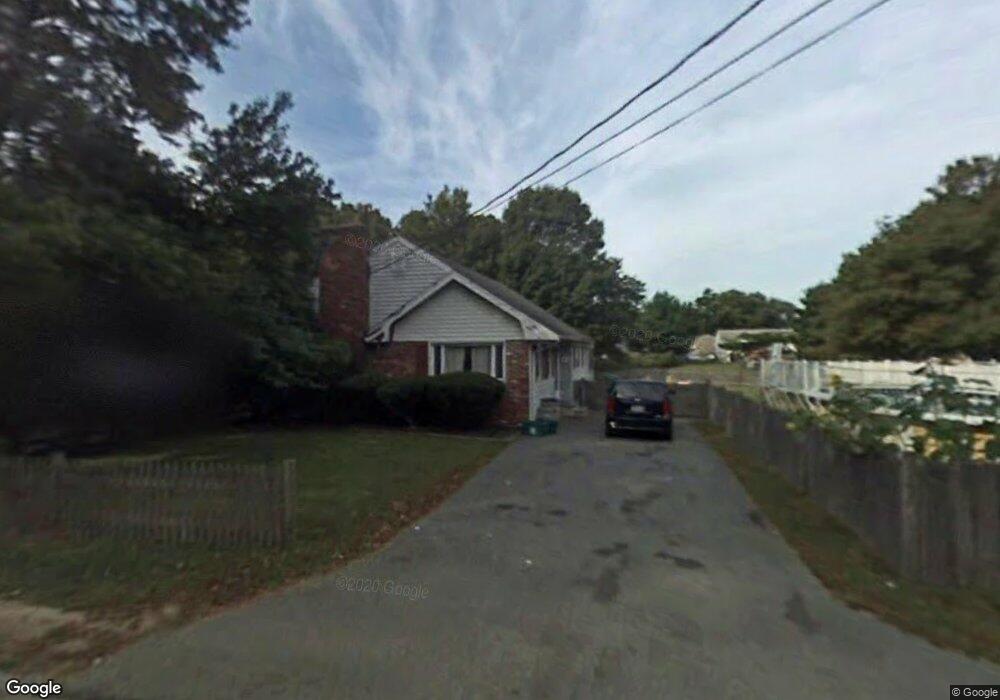
This home is located at 64 N Cary St, Brockton, MA 02302 and is currently estimated at $495,390, approximately $368 per square foot. 64 N Cary St is a home located in Plymouth County with nearby schools including Arnone Elementary School, Joseph F. Plouffe Middle School, and Brockton Area Seventh-Day Adventist Academy.
Ownership History
Date
Name
Owned For
Owner Type
Purchase Details
Closed on
Jan 13, 1993
Sold by
Lombard William A and Lombard Loretta J
Bought by
Premdas Gail Y and Gomes Sopphia M
Current Estimated Value
Home Financials for this Owner
Home Financials are based on the most recent Mortgage that was taken out on this home.
Original Mortgage
$50,000
Interest Rate
8.31%
Mortgage Type
Purchase Money Mortgage
Purchase Details
Closed on
Dec 28, 1992
Sold by
Lombard William A and Lombard Loretta J
Bought by
Premdas Gail Y and Gomes Sophia M
Home Financials for this Owner
Home Financials are based on the most recent Mortgage that was taken out on this home.
Original Mortgage
$50,000
Interest Rate
8.31%
Mortgage Type
Purchase Money Mortgage
Create a Home Valuation Report for This Property
The Home Valuation Report is an in-depth analysis detailing your home's value as well as a comparison with similar homes in the area
Home Values in the Area
Average Home Value in this Area
Purchase History
| Date | Buyer | Sale Price | Title Company |
|---|---|---|---|
| Premdas Gail Y | $114,900 | -- | |
| Premdas Gail Y | $3,791 | -- |
Source: Public Records
Mortgage History
| Date | Status | Borrower | Loan Amount |
|---|---|---|---|
| Closed | Premdas Gail Y | $50,000 |
Source: Public Records
Tax History Compared to Growth
Tax History
| Year | Tax Paid | Tax Assessment Tax Assessment Total Assessment is a certain percentage of the fair market value that is determined by local assessors to be the total taxable value of land and additions on the property. | Land | Improvement |
|---|---|---|---|---|
| 2025 | $4,917 | $406,000 | $140,200 | $265,800 |
| 2024 | $4,869 | $405,100 | $140,200 | $264,900 |
| 2023 | $4,868 | $375,000 | $105,100 | $269,900 |
| 2022 | $4,507 | $322,600 | $95,500 | $227,100 |
| 2021 | $4,224 | $291,300 | $79,500 | $211,800 |
| 2020 | $3,889 | $256,700 | $74,300 | $182,400 |
| 2019 | $3,904 | $251,200 | $72,400 | $178,800 |
| 2018 | $3,684 | $229,400 | $72,400 | $157,000 |
| 2017 | $3,088 | $191,800 | $72,400 | $119,400 |
| 2016 | $3,212 | $185,000 | $70,300 | $114,700 |
| 2015 | $2,942 | $162,100 | $70,300 | $91,800 |
| 2014 | $3,095 | $170,700 | $70,300 | $100,400 |
Source: Public Records
Map
Nearby Homes