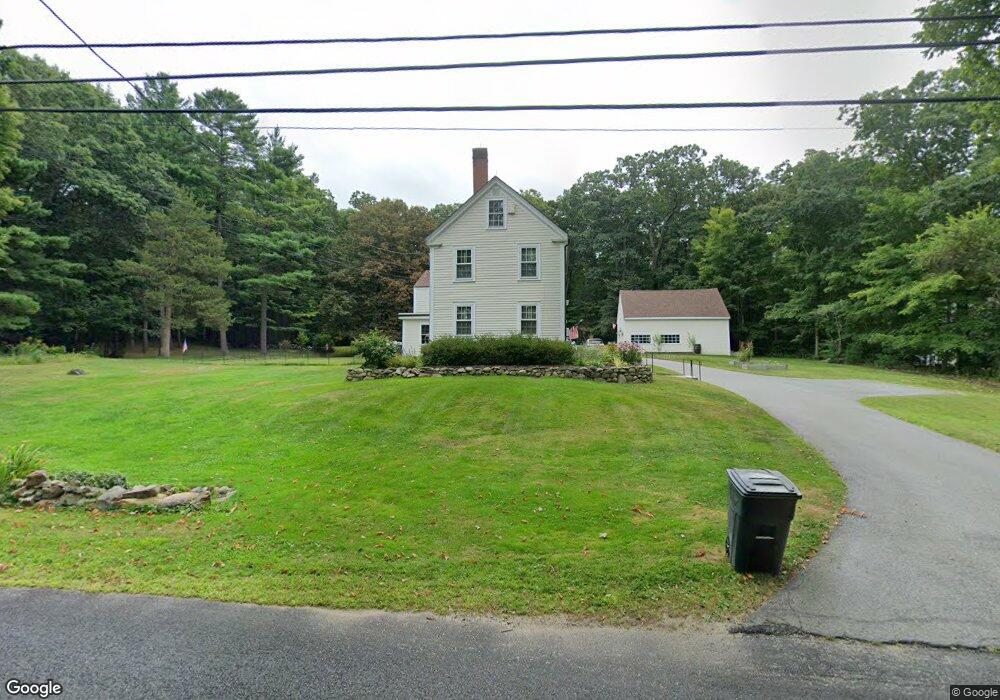
64 Nelson St Georgetown, MA 01833
Estimated Value: $1,068,000 - $1,196,000
4
Beds
4
Baths
3,814
Sq Ft
$293/Sq Ft
Est. Value
About This Home
This home is located at 64 Nelson St, Georgetown, MA 01833 and is currently estimated at $1,117,974, approximately $293 per square foot. 64 Nelson St is a home located in Essex County with nearby schools including Perley Elementary School, Penn Brook School, and Georgetown High School.
Ownership History
Date
Name
Owned For
Owner Type
Purchase Details
Closed on
Aug 26, 1999
Sold by
Shipley Beth A and Durney Peter M
Bought by
Wolf Henry B and Wolf Joan H
Current Estimated Value
Purchase Details
Closed on
Sep 25, 1987
Sold by
Cook Sandra S
Bought by
Durney Peter M
Create a Home Valuation Report for This Property
The Home Valuation Report is an in-depth analysis detailing your home's value as well as a comparison with similar homes in the area
Home Values in the Area
Average Home Value in this Area
Purchase History
| Date | Buyer | Sale Price | Title Company |
|---|---|---|---|
| Wolf Henry B | $435,000 | -- | |
| Durney Peter M | $332,000 | -- |
Source: Public Records
Mortgage History
| Date | Status | Borrower | Loan Amount |
|---|---|---|---|
| Open | Durney Peter M | $150,000 | |
| Previous Owner | Durney Peter M | $86,500 | |
| Previous Owner | Durney Peter M | $25,000 | |
| Previous Owner | Durney Peter M | $196,000 |
Source: Public Records
Tax History
| Year | Tax Paid | Tax Assessment Tax Assessment Total Assessment is a certain percentage of the fair market value that is determined by local assessors to be the total taxable value of land and additions on the property. | Land | Improvement |
|---|---|---|---|---|
| 2025 | $11,543 | $1,043,700 | $312,900 | $730,800 |
| 2024 | $10,143 | $808,200 | $217,400 | $590,800 |
| 2023 | $10,389 | $800,400 | $217,400 | $583,000 |
| 2022 | $10,170 | $722,300 | $189,700 | $532,600 |
| 2021 | $9,939 | $625,500 | $189,700 | $435,800 |
| 2020 | $9,958 | $625,500 | $189,700 | $435,800 |
| 2019 | $9,814 | $621,900 | $186,100 | $435,800 |
| 2018 | $9,876 | $621,900 | $186,100 | $435,800 |
| 2017 | $9,515 | $587,000 | $186,100 | $400,900 |
| 2016 | $9,193 | $579,300 | $186,100 | $393,200 |
| 2015 | $9,004 | $561,700 | $186,100 | $375,600 |
| 2014 | $7,892 | $561,700 | $186,100 | $375,600 |
Source: Public Records
Map
Nearby Homes
- 107 King George Dr Unit 9
- 53 Woodcrest Rd
- 11 Central St
- 534 Ipswich Rd
- 24 Appleton Ln
- 32 Summer St
- 8 Molloy Rd
- 206 W Main St Unit 5
- 206 W Main St Unit 4
- 206 W Main St Unit 2
- 206 W Main St Unit 3
- 98 West St
- 231 W Main St
- 427b Ipswich Rd
- 870 Haverhill St Unit 2B
- Lot B Willow Ave
- 10 Ashcroft Cir
- 499 Main St
- 1 Atwood Ln
- Lot 2 (31) Lawrence Rd
Your Personal Tour Guide
Ask me questions while you tour the home.