64 Oregon St Ypsilanti, MI 48198
Estimated Value: $135,718 - $181,000
3
Beds
1
Bath
754
Sq Ft
$209/Sq Ft
Est. Value
About This Home
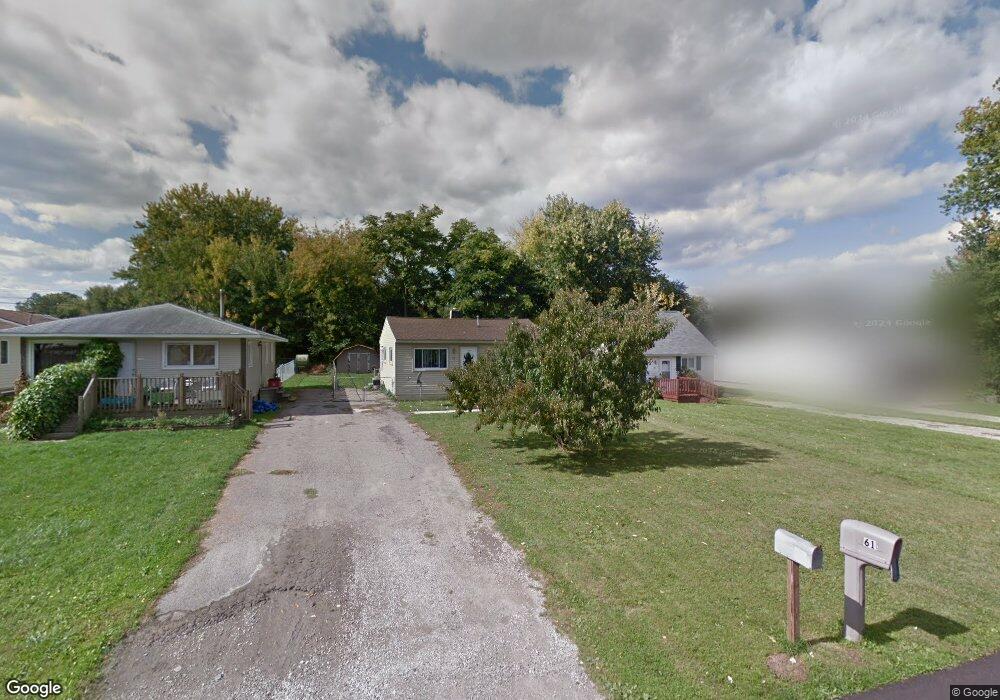
This home is located at 64 Oregon St, Ypsilanti, MI 48198 and is currently estimated at $157,430, approximately $208 per square foot. 64 Oregon St is a home located in Washtenaw County with nearby schools including Holmes Elementary School, Erickson Elementary School, and Estabrook Elementary School.
Ownership History
Date
Name
Owned For
Owner Type
Purchase Details
Closed on
Feb 29, 1996
Sold by
Veterans Affairs
Bought by
Gary Denny
Current Estimated Value
Home Financials for this Owner
Home Financials are based on the most recent Mortgage that was taken out on this home.
Original Mortgage
$35,625
Outstanding Balance
$1,402
Interest Rate
7.06%
Mortgage Type
New Conventional
Estimated Equity
$156,028
Purchase Details
Closed on
Jun 29, 1995
Sold by
Horn Ray E
Bought by
Union Federal Savings Bank Of India Is
Create a Home Valuation Report for This Property
The Home Valuation Report is an in-depth analysis detailing your home's value as well as a comparison with similar homes in the area
Home Values in the Area
Average Home Value in this Area
Purchase History
| Date | Buyer | Sale Price | Title Company |
|---|---|---|---|
| Gary Denny | -- | -- | |
| Union Federal Savings Bank Of India Is | $31,975 | -- |
Source: Public Records
Mortgage History
| Date | Status | Borrower | Loan Amount |
|---|---|---|---|
| Open | Gary Denny | $35,625 |
Source: Public Records
Tax History Compared to Growth
Tax History
| Year | Tax Paid | Tax Assessment Tax Assessment Total Assessment is a certain percentage of the fair market value that is determined by local assessors to be the total taxable value of land and additions on the property. | Land | Improvement |
|---|---|---|---|---|
| 2025 | -- | $55,300 | $0 | $0 |
| 2024 | -- | $45,600 | $0 | $0 |
| 2023 | -- | $41,300 | $0 | $0 |
| 2022 | $0 | $40,700 | $0 | $0 |
| 2021 | $1,449 | $37,500 | $0 | $0 |
| 2020 | $1,449 | $28,000 | $0 | $0 |
| 2019 | $1,449 | $23,700 | $23,700 | $0 |
| 2018 | $0 | $20,700 | $0 | $0 |
| 2017 | $1,453 | $19,500 | $0 | $0 |
| 2016 | $1,018 | $19,257 | $0 | $0 |
| 2015 | $1,391 | $19,200 | $0 | $0 |
| 2014 | $1,391 | $19,100 | $0 | $0 |
| 2013 | -- | $19,100 | $0 | $0 |
Source: Public Records
Map
Nearby Homes