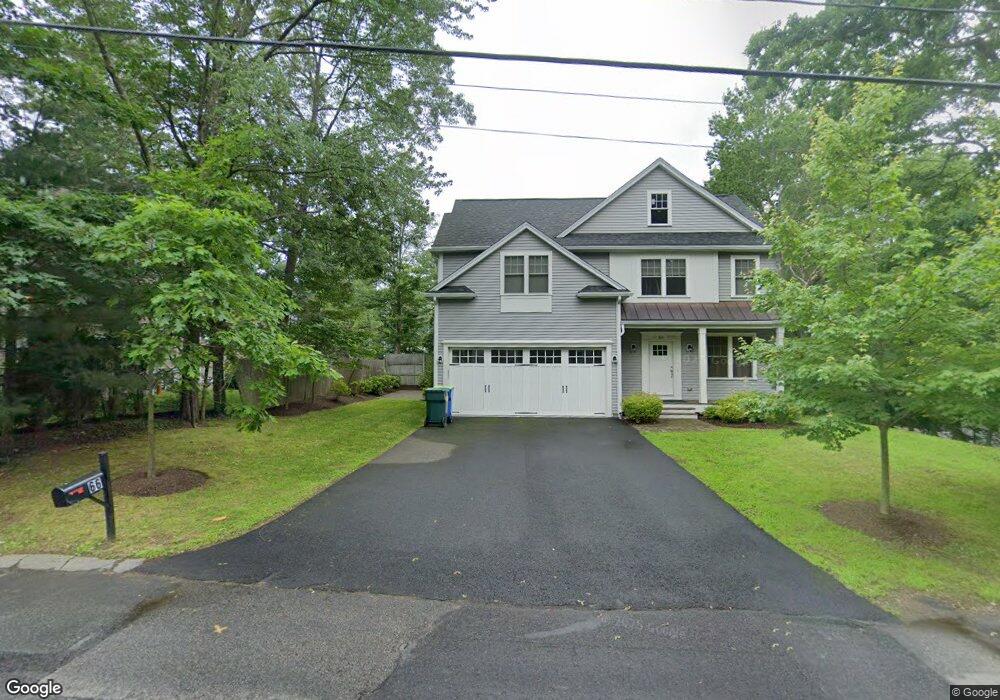
64 Overbrook Dr Wellesley, MA 02482
Estimated Value: $1,853,484 - $1,965,000
4
Beds
4
Baths
2,362
Sq Ft
$809/Sq Ft
Est. Value
About This Home
This home is located at 64 Overbrook Dr, Wellesley, MA 02482 and is currently estimated at $1,911,121, approximately $809 per square foot. 64 Overbrook Dr is a home located in Norfolk County with nearby schools including John D. Hardy Elementary School, Wellesley Middle School, and Wellesley Sr High School.
Ownership History
Date
Name
Owned For
Owner Type
Purchase Details
Closed on
Jun 23, 2022
Sold by
Mao Yan and Xing Peipei
Bought by
Mao Yan
Current Estimated Value
Home Financials for this Owner
Home Financials are based on the most recent Mortgage that was taken out on this home.
Original Mortgage
$532,000
Outstanding Balance
$444,927
Interest Rate
4.48%
Mortgage Type
Stand Alone Refi Refinance Of Original Loan
Estimated Equity
$1,466,194
Purchase Details
Closed on
Jan 18, 2018
Sold by
Madmoejoe Llc
Bought by
Mao Yan and Xing Peipei
Home Financials for this Owner
Home Financials are based on the most recent Mortgage that was taken out on this home.
Original Mortgage
$800,000
Interest Rate
3.5%
Mortgage Type
Unknown
Purchase Details
Closed on
Apr 20, 2017
Sold by
Start Patricia P
Bought by
Madmoejoe Llc
Purchase Details
Closed on
Oct 27, 2016
Sold by
Patricia Pstart Rt
Bought by
Start Patricia P
Create a Home Valuation Report for This Property
The Home Valuation Report is an in-depth analysis detailing your home's value as well as a comparison with similar homes in the area
Purchase History
| Date | Buyer | Sale Price | Title Company |
|---|---|---|---|
| Mao Yan | -- | None Available | |
| Mao Yan | $1,220,888 | -- | |
| Madmoejoe Llc | $400,000 | -- | |
| Start Patricia P | -- | -- | |
| Start Patricia P | -- | -- |
Source: Public Records
Mortgage History
| Date | Status | Borrower | Loan Amount |
|---|---|---|---|
| Open | Mao Yan | $532,000 | |
| Previous Owner | Mao Yan | $800,000 |
Source: Public Records
Tax History
| Year | Tax Paid | Tax Assessment Tax Assessment Total Assessment is a certain percentage of the fair market value that is determined by local assessors to be the total taxable value of land and additions on the property. | Land | Improvement |
|---|---|---|---|---|
| 2025 | $17,281 | $1,681,000 | $864,000 | $817,000 |
| 2024 | $16,323 | $1,568,000 | $781,000 | $787,000 |
| 2023 | $16,110 | $1,407,000 | $698,000 | $709,000 |
| 2022 | $15,196 | $1,301,000 | $544,000 | $757,000 |
| 2021 | $15,287 | $1,301,000 | $544,000 | $757,000 |
| 2020 | $15,040 | $1,301,000 | $544,000 | $757,000 |
| 2019 | $15,064 | $1,302,000 | $544,000 | $758,000 |
| 2018 | $6,250 | $523,000 | $516,000 | $7,000 |
| 2017 | $6,190 | $525,000 | $516,000 | $9,000 |
| 2016 | $6,104 | $516,000 | $507,000 | $9,000 |
| 2015 | $5,433 | $470,000 | $461,000 | $9,000 |
Source: Public Records
Map
Nearby Homes
- 66 Overbrook Dr
- 62 Overbrook Dr
- 37 Edgemoor Ave
- 68 Overbrook Dr
- 33 Edgemoor Ave
- 22-24 Edgemoor Ave
- 61 Overbrook Dr
- 4 High Ledge Ave
- 54 Overbrook Dr
- 36 Edgemoor Ave
- 38 Edgemoor Ave
- 18 High Ledge Ave
- 32 Edgemoor Ave
- 74 Overbrook Dr
- 56 Edgemoor Ave
- 27 Edgemoor Ave
- 51 Overbrook Dr
- 27 Edgemoor Ave
- 10 Hillcroft Rd
- 15 Upland Rd
Your Personal Tour Guide
Ask me questions while you tour the home.