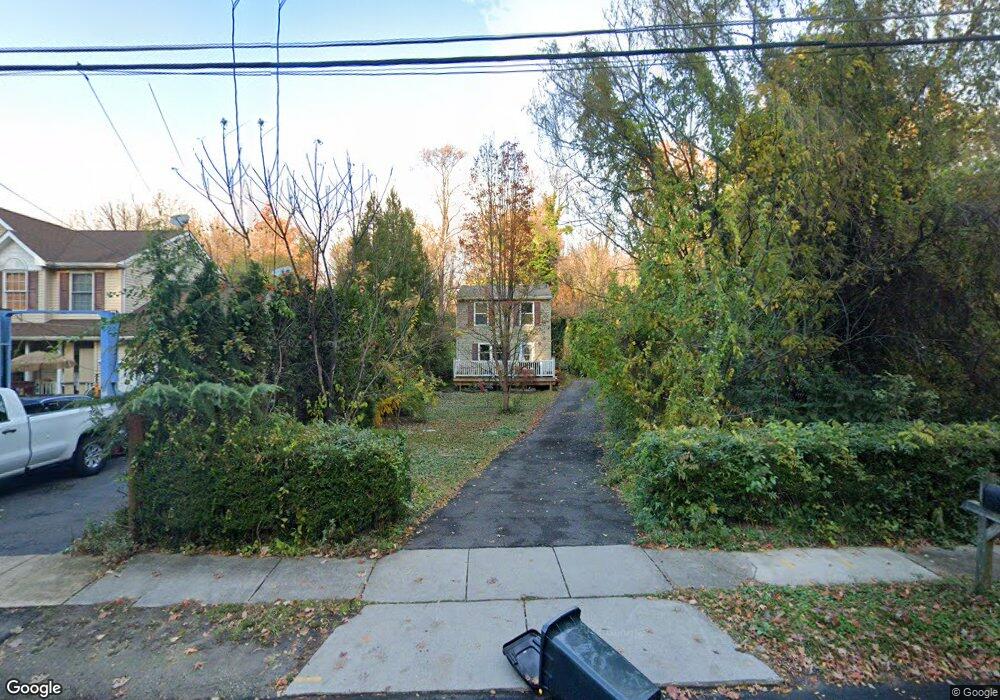
64 Peach St Westville, NJ 08093
Deptford Township NeighborhoodEstimated Value: $238,000 - $283,000
--
Bed
--
Bath
1,029
Sq Ft
$247/Sq Ft
Est. Value
About This Home
This home is located at 64 Peach St, Westville, NJ 08093 and is currently estimated at $254,266, approximately $247 per square foot. 64 Peach St is a home located in Gloucester County with nearby schools including Deptford Township High School and Holy Angels Catholic School.
Ownership History
Date
Name
Owned For
Owner Type
Purchase Details
Closed on
Jan 20, 2006
Sold by
Domanick Thomas
Bought by
Bozarth Douglas C
Current Estimated Value
Home Financials for this Owner
Home Financials are based on the most recent Mortgage that was taken out on this home.
Original Mortgage
$123,920
Outstanding Balance
$69,941
Interest Rate
6.34%
Mortgage Type
Purchase Money Mortgage
Estimated Equity
$184,325
Purchase Details
Closed on
Oct 12, 2005
Sold by
Kilroy Jean D
Bought by
Domanick Thomas and Domanick Marie
Purchase Details
Closed on
Aug 26, 1998
Sold by
Wilcox Paul and Chrysler Credit Corp
Bought by
Va
Purchase Details
Closed on
Feb 1, 1996
Sold by
Jones Jason M
Bought by
Wilcox Paul
Home Financials for this Owner
Home Financials are based on the most recent Mortgage that was taken out on this home.
Original Mortgage
$76,500
Interest Rate
7.81%
Mortgage Type
VA
Purchase Details
Closed on
Feb 28, 1995
Sold by
Lewis Sandra and Moore Phoebe A
Bought by
Jones Jason M
Create a Home Valuation Report for This Property
The Home Valuation Report is an in-depth analysis detailing your home's value as well as a comparison with similar homes in the area
Home Values in the Area
Average Home Value in this Area
Purchase History
| Date | Buyer | Sale Price | Title Company |
|---|---|---|---|
| Bozarth Douglas C | $154,900 | -- | |
| Domanick Thomas | $98,000 | Group 21 | |
| Va | -- | Stewart Title Guaranty Compa | |
| Wilcox Paul | $75,000 | -- | |
| Jones Jason M | $16,500 | Congress Title Corp |
Source: Public Records
Mortgage History
| Date | Status | Borrower | Loan Amount |
|---|---|---|---|
| Open | Bozarth Douglas C | $123,920 | |
| Previous Owner | Wilcox Paul | $76,500 |
Source: Public Records
Tax History Compared to Growth
Tax History
| Year | Tax Paid | Tax Assessment Tax Assessment Total Assessment is a certain percentage of the fair market value that is determined by local assessors to be the total taxable value of land and additions on the property. | Land | Improvement |
|---|---|---|---|---|
| 2025 | $3,994 | $111,400 | $42,200 | $69,200 |
| 2024 | $3,866 | $111,400 | $42,200 | $69,200 |
| 2023 | $3,866 | $111,400 | $42,200 | $69,200 |
| 2022 | $3,838 | $111,400 | $42,200 | $69,200 |
| 2021 | $3,783 | $111,400 | $42,200 | $69,200 |
| 2020 | $3,703 | $110,300 | $42,200 | $68,100 |
| 2019 | $3,632 | $110,300 | $42,200 | $68,100 |
| 2018 | $3,551 | $110,300 | $42,200 | $68,100 |
| 2017 | $3,456 | $110,300 | $42,200 | $68,100 |
| 2016 | $3,385 | $110,300 | $42,200 | $68,100 |
| 2015 | $3,280 | $110,300 | $42,200 | $68,100 |
| 2014 | $3,195 | $110,300 | $42,200 | $68,100 |
Source: Public Records
Map
Nearby Homes
- 86 Peach St
- 17 Peach St
- 17 Magnolia St
- 56 Fisher Ave
- 1504 Clearbrook Ave
- 1190 Broadway
- 615 Lot: 1.01 Carteret
- 615 L1.02 Carteret Ave
- 13 Cordelia Ave
- 233 Marion Ave
- 372 Marion Ave
- 761 Carteret Ave
- 1415 Lafayette Ave
- 1337 Lincoln Ave
- 66 Hessian Ave
- 353 Dare St
- 787 Tacoma Blvd
- 112 Progress Ave
- 338 E Red Bank Ave
- 406 Winding Way