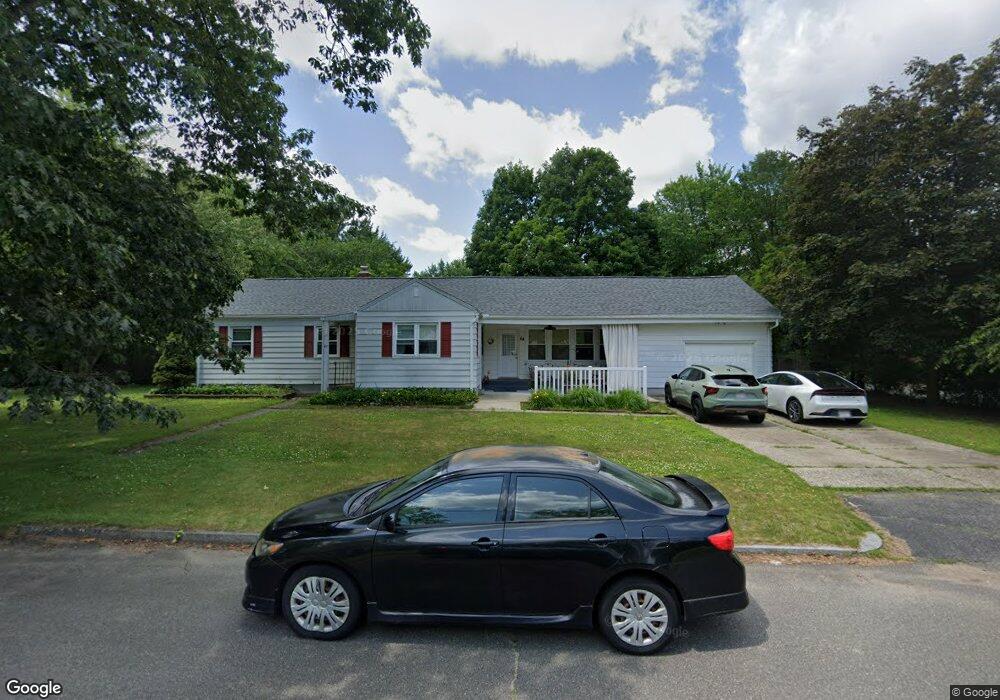
64 Pineview Dr Springfield, MA 01119
Sixteen Acres NeighborhoodEstimated Value: $323,000 - $349,000
3
Beds
2
Baths
1,242
Sq Ft
$269/Sq Ft
Est. Value
About This Home
This home is located at 64 Pineview Dr, Springfield, MA 01119 and is currently estimated at $333,761, approximately $268 per square foot. 64 Pineview Dr is a home located in Hampden County with nearby schools including Glickman Elementary, John J Duggan Middle, and Springfield High School of Science and Technology.
Ownership History
Date
Name
Owned For
Owner Type
Purchase Details
Closed on
Oct 31, 2002
Sold by
Mccarthy Paul K
Bought by
Alvarez Daniel and Alvarez Mary R
Current Estimated Value
Home Financials for this Owner
Home Financials are based on the most recent Mortgage that was taken out on this home.
Original Mortgage
$144,728
Interest Rate
6.09%
Mortgage Type
Purchase Money Mortgage
Create a Home Valuation Report for This Property
The Home Valuation Report is an in-depth analysis detailing your home's value as well as a comparison with similar homes in the area
Home Values in the Area
Average Home Value in this Area
Purchase History
| Date | Buyer | Sale Price | Title Company |
|---|---|---|---|
| Alvarez Daniel | $147,000 | -- |
Source: Public Records
Mortgage History
| Date | Status | Borrower | Loan Amount |
|---|---|---|---|
| Open | Alvarez Daniel | $137,700 | |
| Closed | Alvarez Daniel | $13,300 | |
| Closed | Alvarez Daniel | $144,728 | |
| Previous Owner | Alvarez Daniel | $15,000 |
Source: Public Records
Tax History
| Year | Tax Paid | Tax Assessment Tax Assessment Total Assessment is a certain percentage of the fair market value that is determined by local assessors to be the total taxable value of land and additions on the property. | Land | Improvement |
|---|---|---|---|---|
| 2025 | $4,895 | $312,200 | $56,300 | $255,900 |
| 2024 | $4,286 | $266,900 | $56,300 | $210,600 |
| 2023 | $3,656 | $214,400 | $53,600 | $160,800 |
| 2022 | $3,851 | $204,600 | $53,600 | $151,000 |
| 2021 | $3,663 | $193,800 | $48,800 | $145,000 |
| 2020 | $3,504 | $179,400 | $48,800 | $130,600 |
| 2019 | $3,363 | $170,900 | $48,800 | $122,100 |
| 2018 | $3,375 | $171,500 | $48,800 | $122,700 |
| 2017 | $3,169 | $161,200 | $48,300 | $112,900 |
| 2016 | $3,016 | $153,400 | $48,300 | $105,100 |
| 2015 | $2,970 | $151,000 | $48,300 | $102,700 |
Source: Public Records
Map
Nearby Homes
- 63 Granger St
- 106-108 Breckwood Cir
- 854 Grayson Dr
- 108 Birchland Ave
- 64 Wilmington St
- 74 Valley Rd
- 73 Timber Ln
- 381 N Brook Rd
- 251 Rosewell St
- 130 Spear Rd
- 8 Putnam St
- 63 Lawton St
- 187 Lamont St
- 114 Riverton Rd
- 150 Seymour Ave
- 944 Wilbraham Rd
- 46 Puritan Cir
- Lot 37 Kane St
- 195 Almira Rd
- 186 Bolton St
Your Personal Tour Guide
Ask me questions while you tour the home.