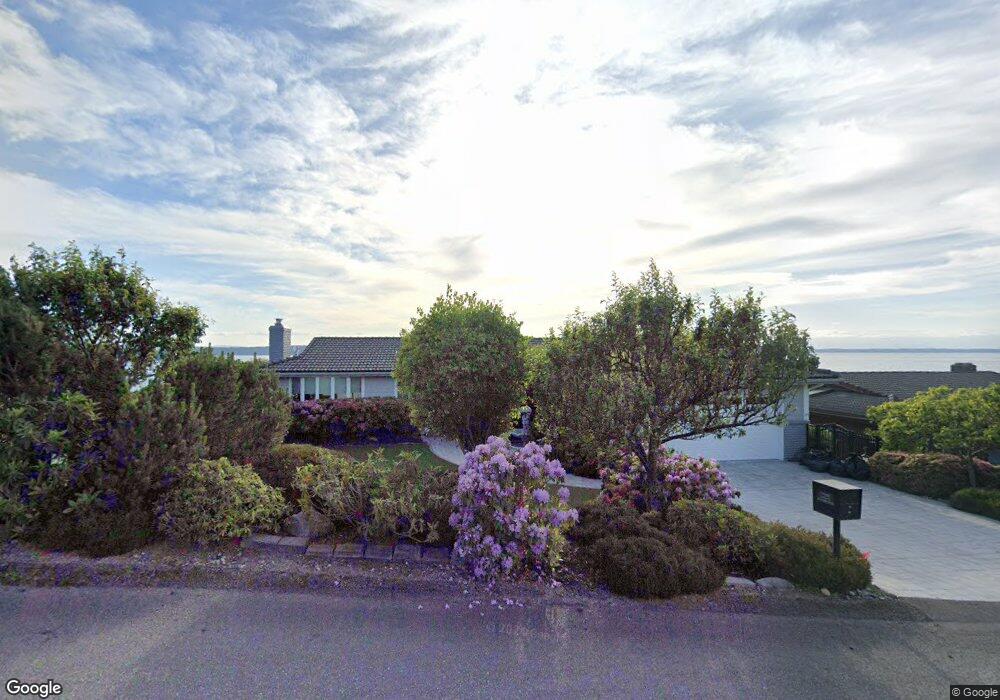
64 Puget Dr Steilacoom, WA 98388
Estimated Value: $984,000 - $1,286,000
4
Beds
3
Baths
1,464
Sq Ft
$787/Sq Ft
Est. Value
About This Home
This home is located at 64 Puget Dr, Steilacoom, WA 98388 and is currently estimated at $1,151,526, approximately $786 per square foot. 64 Puget Dr is a home located in Pierce County with nearby schools including Cherrydale Elementary School, Saltars Point Elementary School, and Pioneer Middle School.
Ownership History
Date
Name
Owned For
Owner Type
Purchase Details
Closed on
Dec 12, 2019
Sold by
Hemman Eileen A
Bought by
Hemman Eileen A and Hemman Revocable Livi Eileen A
Current Estimated Value
Purchase Details
Closed on
Jul 23, 2015
Sold by
Hemman Eileen Ann
Bought by
Hemman Eileen Ann
Purchase Details
Closed on
Dec 26, 2001
Sold by
Cleaver John N
Bought by
Hemman Dale W and Hemman Eileen A
Home Financials for this Owner
Home Financials are based on the most recent Mortgage that was taken out on this home.
Original Mortgage
$300,700
Outstanding Balance
$121,130
Interest Rate
6.84%
Estimated Equity
$1,030,396
Purchase Details
Closed on
May 16, 1997
Sold by
Friend Jan and Friend Lydia K
Bought by
Cleaver John N and Cleaver Jill K
Home Financials for this Owner
Home Financials are based on the most recent Mortgage that was taken out on this home.
Original Mortgage
$140,000
Interest Rate
5.45%
Create a Home Valuation Report for This Property
The Home Valuation Report is an in-depth analysis detailing your home's value as well as a comparison with similar homes in the area
Home Values in the Area
Average Home Value in this Area
Purchase History
| Date | Buyer | Sale Price | Title Company |
|---|---|---|---|
| Hemman Eileen A | -- | None Available | |
| Hemman Eileen Ann | -- | None Available | |
| Hemman Dale W | $494,444 | Commonwealth Title Co | |
| Cleaver John N | $395,555 | Chicago Title |
Source: Public Records
Mortgage History
| Date | Status | Borrower | Loan Amount |
|---|---|---|---|
| Open | Hemman Dale W | $300,700 | |
| Previous Owner | Cleaver John N | $140,000 |
Source: Public Records
Tax History Compared to Growth
Tax History
| Year | Tax Paid | Tax Assessment Tax Assessment Total Assessment is a certain percentage of the fair market value that is determined by local assessors to be the total taxable value of land and additions on the property. | Land | Improvement |
|---|---|---|---|---|
| 2025 | $8,472 | $1,033,100 | $617,800 | $415,300 |
| 2024 | $8,472 | $1,013,700 | $605,500 | $408,200 |
| 2023 | $8,472 | $984,100 | $608,400 | $375,700 |
| 2022 | $8,199 | $996,700 | $628,100 | $368,600 |
| 2021 | $8,380 | $778,000 | $493,800 | $284,200 |
| 2019 | $7,259 | $712,900 | $437,100 | $275,800 |
| 2018 | $7,538 | $655,500 | $398,000 | $257,500 |
| 2017 | $6,743 | $592,700 | $349,400 | $243,300 |
| 2016 | $6,157 | $555,900 | $324,000 | $231,900 |
| 2014 | $6,051 | $479,600 | $268,400 | $211,200 |
| 2013 | $6,051 | $445,400 | $237,700 | $207,700 |
Source: Public Records
Map
Nearby Homes
- 38 Puget Dr
- 2805 Chambers Bay Dr
- 2810 Garden Ct Unit A
- 2822 Garden Ct Unit B
- 2110 Lafayette St
- 409 Isaac Pincus St
- 303 Puyallup St
- 9211 105th Avenue Ct SW Unit 1B
- 1810 Rainier St
- 10701 Mount Tacoma Dr SW
- 9601 108th Ave SW
- 715 Stevens St
- 1514 Rainier St
- 1607 Harrison St
- 430 Stevens St
- 815 Blaine St
- 10802 99th St SW
- 2405 B St
- 728 Blaine St
- 1410 Sequalish St