M
Seller's Agent in 2013
Mike Foley
Fenway Property Advisors
(617) 947-2133
3 in this area
11 Total Sales
Estimated Value: $436,450 - $497,000
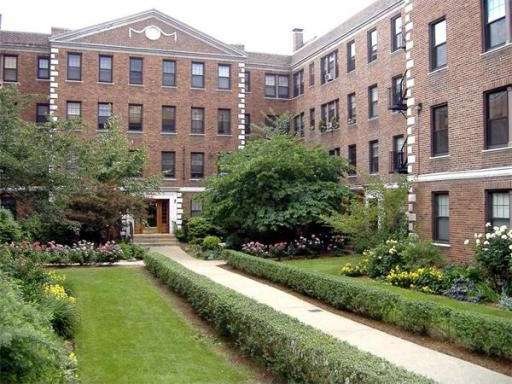
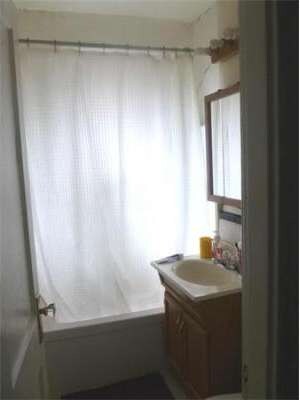
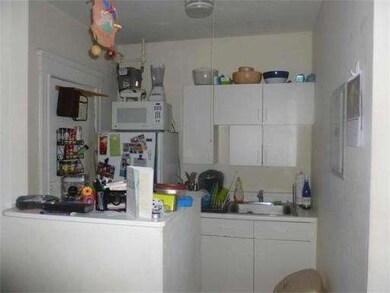
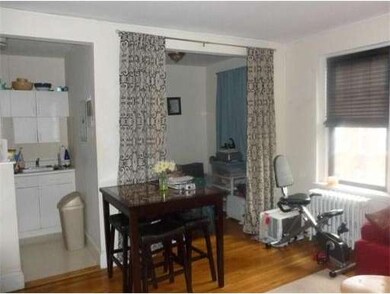
This home is located at 64 Queensberry St Unit 414, Boston, MA 02215 since 15 April 2013 and is currently estimated at $458,613, approximately $1,175 per square foot. This property was built in 1910. 64 Queensberry St Unit 414 is a home located in Suffolk County with nearby schools including Winsor School.
Home Type
Condominium
Est. Annual Taxes
$4,779
Year Built
1910
Lot Details
0
| Date | Buyer | Sale Price | Title Company |
|---|---|---|---|
| Jaw Investment Properties | -- | None Available | |
| Weisman Jonathan A | -- | None Available | |
| Jaw Investment Properties | -- | -- | |
| Weisman Jonathan A | -- | -- | |
| Jaw Investment Propert | -- | -- | |
| Weisman Jonathan A | -- | -- | |
| Jaw Investment Propert | -- | -- | |
| Weisman Jonathan | $239,000 | -- | |
| Graham Lise M | $165,000 | -- | |
| Mehosky Scott D | $156,000 | -- | |
| Lewis Judith A | $109,000 | -- | |
| Blotner Mark | $29,000 | -- | |
| Windeb Funding T | $30,000 | -- |
| Date | Status | Borrower | Loan Amount |
|---|---|---|---|
| Open | Weisman Jonathan A | $370,000 | |
| Previous Owner | Weisman Jonathan A | $375,000 | |
| Previous Owner | Weisman Jonathan A | $385,000 | |
| Previous Owner | Weisman Jonathan | $167,300 | |
| Previous Owner | Weisman Jonathan | $167,300 | |
| Previous Owner | Windeb Funding T | $140,400 | |
| Previous Owner | Windeb Funding T | $106,603 | |
| Previous Owner | Windeb Funding T | $2,000,000 |
| Date | Event | Price | Change | Sq Ft Price |
|---|---|---|---|---|
| 07/01/2013 07/01/13 | Sold | $235,000 | -1.7% | $603 / Sq Ft |
| 04/23/2013 04/23/13 | Pending | -- | -- | -- |
| 04/22/2013 04/22/13 | For Sale | $239,000 | 0.0% | $613 / Sq Ft |
| 04/18/2013 04/18/13 | Pending | -- | -- | -- |
| 04/15/2013 04/15/13 | For Sale | $239,000 | -- | $613 / Sq Ft |
| Year | Tax Paid | Tax Assessment Tax Assessment Total Assessment is a certain percentage of the fair market value that is determined by local assessors to be the total taxable value of land and additions on the property. | Land | Improvement |
|---|---|---|---|---|
| 2025 | $4,779 | $412,700 | $0 | $412,700 |
| 2024 | $4,455 | $408,700 | $0 | $408,700 |
| 2023 | $4,258 | $396,500 | $0 | $396,500 |
| 2022 | $4,230 | $388,800 | $0 | $388,800 |
| 2021 | $4,067 | $381,200 | $0 | $381,200 |
| 2020 | $3,661 | $346,700 | $0 | $346,700 |
| 2019 | $3,416 | $324,100 | $0 | $324,100 |
| 2018 | $3,146 | $300,200 | $0 | $300,200 |
| 2017 | $3,027 | $285,800 | $0 | $285,800 |
| 2016 | $2,993 | $272,100 | $0 | $272,100 |
| 2015 | $2,764 | $228,200 | $0 | $228,200 |
| 2014 | $2,693 | $214,100 | $0 | $214,100 |
M
Seller's Agent in 2013
Mike Foley
Fenway Property Advisors
(617) 947-2133
3 in this area
11 Total Sales
Source: MLS Property Information Network (MLS PIN)
MLS Number: 71509017
APN: CBOS-000000-000005-004283-000104
Disclaimer: Certain information contained herein is derived from information provided by parties other than Homes.com. All information provided is deemed reliable, but is not guaranteed to be accurate and should be independently verified.
![]() The property listing data and information, or the Images, set forth herein were provided to MLS Property Information Network, Inc. from third party sources, including sellers, lessors and public records, and were compiled by MLS Property Information Network, Inc. The property listing data and information, and the Images, are for the personal, non-commercial use of consumers having a good faith interest in purchasing or leasing listed properties of the type displayed to them and may not be used for any purpose other than to identify prospective properties which such consumers may have a good faith interest in purchasing or leasing. MLS Property Information Network, Inc. and its subscribers disclaim any and all representations and warranties as to the accuracy of the property listing data and information, or as to the accuracy of any of the Images, set forth herein.
The property listing data and information, or the Images, set forth herein were provided to MLS Property Information Network, Inc. from third party sources, including sellers, lessors and public records, and were compiled by MLS Property Information Network, Inc. The property listing data and information, and the Images, are for the personal, non-commercial use of consumers having a good faith interest in purchasing or leasing listed properties of the type displayed to them and may not be used for any purpose other than to identify prospective properties which such consumers may have a good faith interest in purchasing or leasing. MLS Property Information Network, Inc. and its subscribers disclaim any and all representations and warranties as to the accuracy of the property listing data and information, or as to the accuracy of any of the Images, set forth herein.
