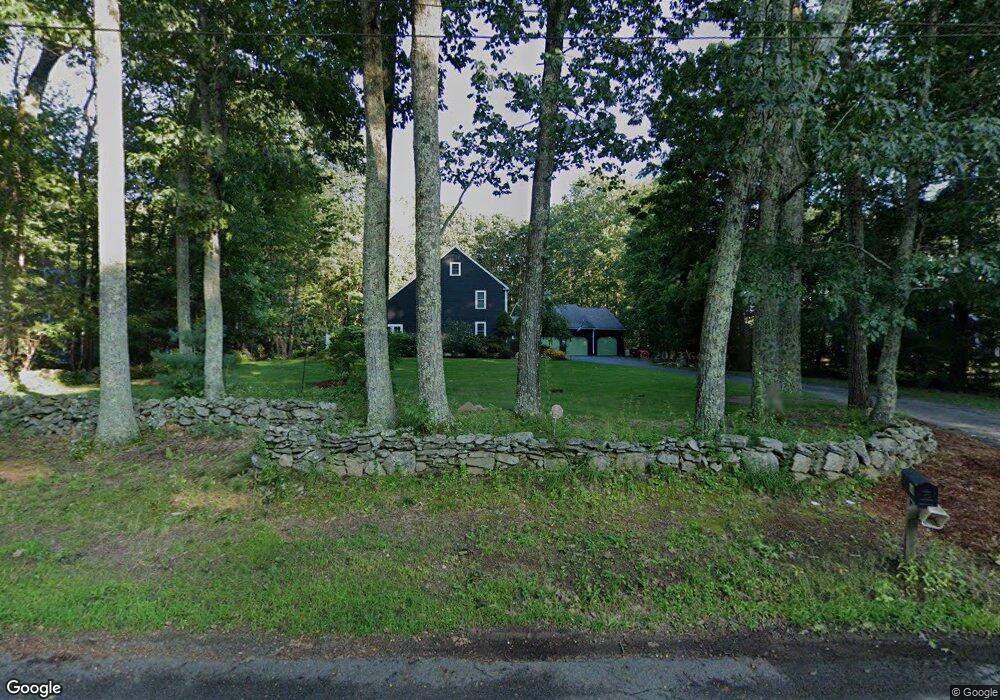
64 Smith Rd Charlton, MA 01507
Estimated Value: $640,351 - $884,000
5
Beds
4
Baths
2,880
Sq Ft
$271/Sq Ft
Est. Value
About This Home
This home is located at 64 Smith Rd, Charlton, MA 01507 and is currently estimated at $780,838, approximately $271 per square foot. 64 Smith Rd is a home located in Worcester County with nearby schools including Shepherd Hill Regional High School.
Ownership History
Date
Name
Owned For
Owner Type
Purchase Details
Closed on
Jul 23, 1993
Sold by
Richard Lussier & Sons
Bought by
Birtz Durwood M and Birtz Donna
Current Estimated Value
Home Financials for this Owner
Home Financials are based on the most recent Mortgage that was taken out on this home.
Original Mortgage
$115,000
Interest Rate
7.43%
Mortgage Type
Purchase Money Mortgage
Create a Home Valuation Report for This Property
The Home Valuation Report is an in-depth analysis detailing your home's value as well as a comparison with similar homes in the area
Home Values in the Area
Average Home Value in this Area
Purchase History
| Date | Buyer | Sale Price | Title Company |
|---|---|---|---|
| Birtz Durwood M | $205,000 | -- | |
| Birtz Durwood M | $205,000 | -- |
Source: Public Records
Mortgage History
| Date | Status | Borrower | Loan Amount |
|---|---|---|---|
| Open | Birtz Durwood M | $50,000 | |
| Closed | Birtz Durwood M | $35,000 | |
| Closed | Birtz Durwood M | $115,000 | |
| Closed | Birtz Durwood M | $65,900 |
Source: Public Records
Tax History
| Year | Tax Paid | Tax Assessment Tax Assessment Total Assessment is a certain percentage of the fair market value that is determined by local assessors to be the total taxable value of land and additions on the property. | Land | Improvement |
|---|---|---|---|---|
| 2025 | $7,306 | $656,400 | $111,100 | $545,300 |
| 2024 | $7,053 | $622,000 | $105,100 | $516,900 |
| 2023 | $6,932 | $569,600 | $105,100 | $464,500 |
| 2022 | $6,753 | $508,100 | $96,100 | $412,000 |
| 2021 | $6,255 | $416,700 | $84,100 | $332,600 |
| 2020 | $6,136 | $410,700 | $78,100 | $332,600 |
| 2019 | $6,066 | $410,700 | $78,100 | $332,600 |
| 2018 | $5,544 | $410,700 | $78,100 | $332,600 |
| 2017 | $5,744 | $407,400 | $78,100 | $329,300 |
| 2016 | $5,614 | $407,400 | $78,100 | $329,300 |
| 2015 | $5,467 | $407,400 | $78,100 | $329,300 |
| 2014 | $5,141 | $406,100 | $73,100 | $333,000 |
Source: Public Records
Map
Nearby Homes
- 1 Cole Dr Unit 1
- 8 Hycrest Rd
- 7 Hycrest Rd
- 4 N Meadow Ln
- 94 Clark Rd
- Lot 2 Gould Rd
- Lot 1 Gould Rd
- Lot 3 Gould Rd
- Lot 9 Gould Rd
- Lot 4 Gould Rd
- Lot 5 Gould Rd
- 0 Hammond Hill Rd
- 6 Laurelwood Dr
- 40 Carroll Hill Rd
- 620 Henshaw St
- 748-A Stafford St
- 0 Oxbow Rd
- 10 Edward St
- 24 Thayer Pond Dr Unit 17
- 34 Thayer Pond Dr Unit 8
Your Personal Tour Guide
Ask me questions while you tour the home.