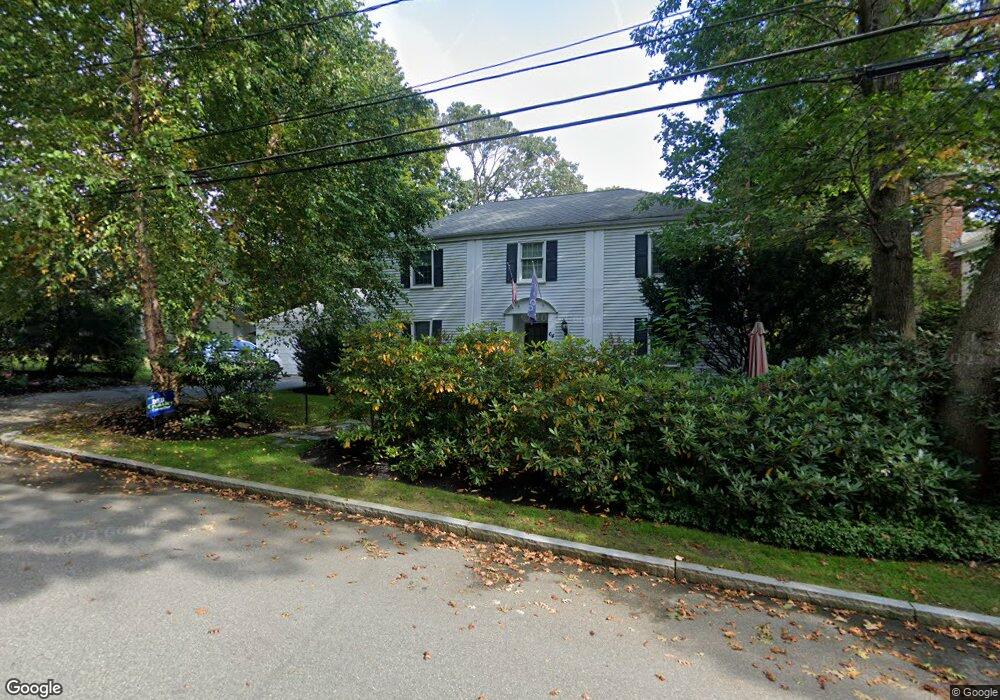
64 Varick Rd Waban, MA 02468
Waban NeighborhoodEstimated Value: $2,373,533 - $2,501,000
4
Beds
4
Baths
2,865
Sq Ft
$854/Sq Ft
Est. Value
About This Home
This home is located at 64 Varick Rd, Waban, MA 02468 and is currently estimated at $2,445,383, approximately $853 per square foot. 64 Varick Rd is a home located in Middlesex County with nearby schools including Angier Elementary School, Charles E Brown Middle School, and Newton South High School.
Ownership History
Date
Name
Owned For
Owner Type
Purchase Details
Closed on
Jan 13, 2011
Sold by
Varick Road Rt and Bracken William D
Bought by
Bracken William and Bracken Natasha
Current Estimated Value
Home Financials for this Owner
Home Financials are based on the most recent Mortgage that was taken out on this home.
Original Mortgage
$204,000
Outstanding Balance
$134,844
Interest Rate
4.46%
Mortgage Type
Purchase Money Mortgage
Estimated Equity
$2,310,539
Purchase Details
Closed on
Jun 27, 2008
Sold by
Bracken Tasha L and Bracken William D
Bought by
Varick Road Rt and Bracken William D
Home Financials for this Owner
Home Financials are based on the most recent Mortgage that was taken out on this home.
Original Mortgage
$201,000
Interest Rate
6.07%
Mortgage Type
Purchase Money Mortgage
Create a Home Valuation Report for This Property
The Home Valuation Report is an in-depth analysis detailing your home's value as well as a comparison with similar homes in the area
Home Values in the Area
Average Home Value in this Area
Purchase History
| Date | Buyer | Sale Price | Title Company |
|---|---|---|---|
| Bracken William | -- | -- | |
| Varick Road Rt | -- | -- | |
| Bracken Tasha L | -- | -- |
Source: Public Records
Mortgage History
| Date | Status | Borrower | Loan Amount |
|---|---|---|---|
| Open | Bracken William | $204,000 | |
| Previous Owner | Bracken Tasha L | $201,000 |
Source: Public Records
Tax History
| Year | Tax Paid | Tax Assessment Tax Assessment Total Assessment is a certain percentage of the fair market value that is determined by local assessors to be the total taxable value of land and additions on the property. | Land | Improvement |
|---|---|---|---|---|
| 2025 | $15,923 | $1,624,800 | $1,426,000 | $198,800 |
| 2024 | $15,396 | $1,577,500 | $1,384,500 | $193,000 |
| 2023 | $14,754 | $1,449,300 | $1,080,800 | $368,500 |
| 2022 | $14,117 | $1,341,900 | $1,000,700 | $341,200 |
| 2021 | $13,621 | $1,265,900 | $944,100 | $321,800 |
| 2020 | $13,216 | $1,265,900 | $944,100 | $321,800 |
| 2019 | $12,843 | $1,229,000 | $916,600 | $312,400 |
| 2018 | $12,449 | $1,150,600 | $826,900 | $323,700 |
| 2017 | $12,005 | $1,079,600 | $780,100 | $299,500 |
| 2016 | $11,126 | $977,700 | $729,100 | $248,600 |
| 2015 | $10,608 | $913,700 | $681,400 | $232,300 |
Source: Public Records
Map
Nearby Homes
- 43 Palmer Rd
- 447 Waban Ave
- 50 Dwhinda Rd
- 0 Metacomet Rd
- 33 Metacomet Rd
- 1806 Beacon St
- 34 Pilgrim Rd
- 2323 Washington St Unit 1-6
- 86 Waban Ave
- 577 Grove St
- 20 Kinmonth Rd Unit 4
- 18 Annawan Rd
- 225 Walnut St
- 32 Lantern Ln
- 6 Willow St
- 151 Pine Ridge Rd
- 69 Karen Rd
- 49 Whittier Rd
- 8 Tennyson Rd
- 32 Pickwick Rd
Your Personal Tour Guide
Ask me questions while you tour the home.