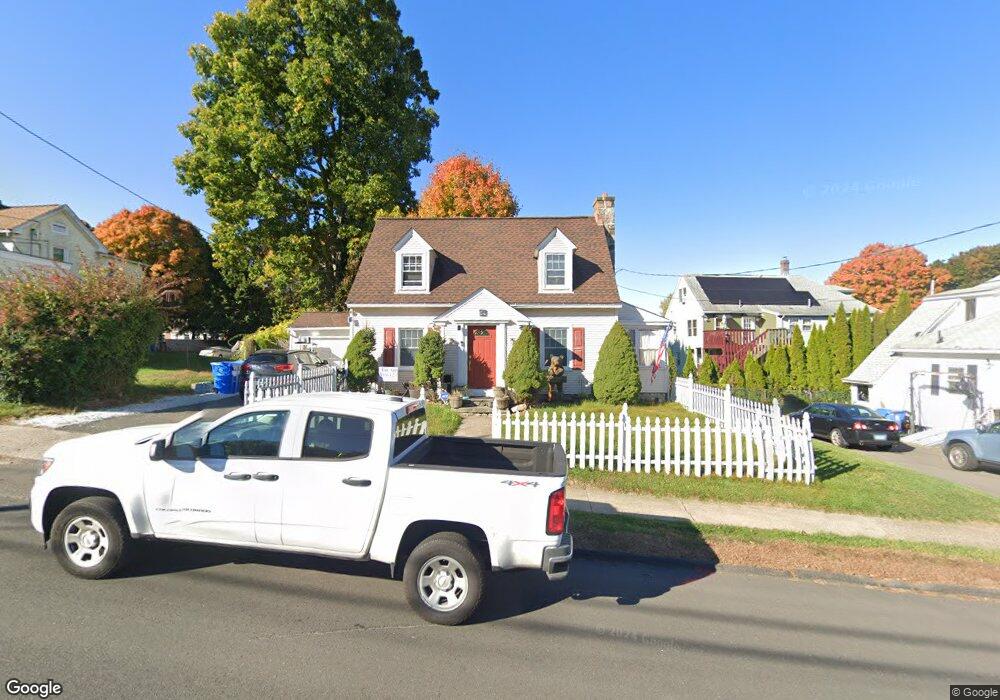
64 View St Bristol, CT 06010
South Bristol NeighborhoodEstimated Value: $280,081 - $316,000
2
Beds
2
Baths
1,460
Sq Ft
$203/Sq Ft
Est. Value
About This Home
This home is located at 64 View St, Bristol, CT 06010 and is currently estimated at $296,770, approximately $203 per square foot. 64 View St is a home located in Hartford County with nearby schools including West Bristol Sch, Bristol Central High School, and Immanuel Lutheran School.
Ownership History
Date
Name
Owned For
Owner Type
Purchase Details
Closed on
Aug 3, 2009
Sold by
Mcconville Andrew J
Bought by
Kivlehan George A and Kivlehan Khristine C
Current Estimated Value
Home Financials for this Owner
Home Financials are based on the most recent Mortgage that was taken out on this home.
Original Mortgage
$173,042
Interest Rate
5.43%
Purchase Details
Closed on
Mar 29, 2005
Sold by
Colapinto Susan M
Bought by
Mcconville Andrew J
Create a Home Valuation Report for This Property
The Home Valuation Report is an in-depth analysis detailing your home's value as well as a comparison with similar homes in the area
Home Values in the Area
Average Home Value in this Area
Purchase History
| Date | Buyer | Sale Price | Title Company |
|---|---|---|---|
| Kivlehan George A | $169,500 | -- | |
| Mcconville Andrew J | $152,500 | -- |
Source: Public Records
Mortgage History
| Date | Status | Borrower | Loan Amount |
|---|---|---|---|
| Open | Mcconville Andrew J | $180,775 | |
| Closed | Mcconville Andrew J | $173,042 | |
| Previous Owner | Mcconville Andrew J | $144,000 | |
| Previous Owner | Mcconville Andrew J | $15,000 |
Source: Public Records
Tax History
| Year | Tax Paid | Tax Assessment Tax Assessment Total Assessment is a certain percentage of the fair market value that is determined by local assessors to be the total taxable value of land and additions on the property. | Land | Improvement |
|---|---|---|---|---|
| 2025 | $4,307 | $127,610 | $30,310 | $97,300 |
| 2024 | $4,064 | $127,610 | $30,310 | $97,300 |
| 2023 | $3,873 | $127,610 | $30,310 | $97,300 |
| 2022 | $3,576 | $93,240 | $22,960 | $70,280 |
| 2021 | $3,576 | $93,240 | $22,960 | $70,280 |
| 2020 | $3,576 | $93,240 | $22,960 | $70,280 |
| 2019 | $3,548 | $93,240 | $22,960 | $70,280 |
| 2018 | $3,439 | $93,240 | $22,960 | $70,280 |
| 2017 | $3,503 | $97,230 | $32,760 | $64,470 |
| 2016 | $3,503 | $97,230 | $32,760 | $64,470 |
| 2015 | $3,365 | $97,230 | $32,760 | $64,470 |
| 2014 | -- | $97,230 | $32,760 | $64,470 |
Source: Public Records
Map
Nearby Homes
Your Personal Tour Guide
Ask me questions while you tour the home.