Estimated Value: $352,000 - $423,000
--
Bed
--
Bath
1,308
Sq Ft
$289/Sq Ft
Est. Value
About This Home
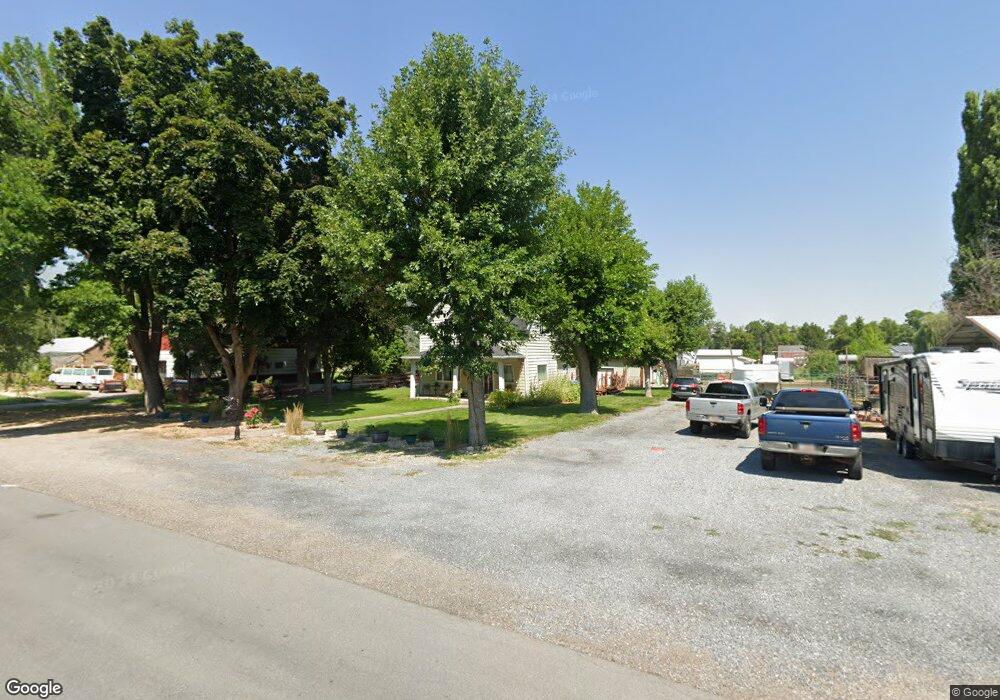
This home is located at 64 W 200 S, Hyrum, UT 84319 and is currently estimated at $377,539, approximately $288 per square foot. 64 W 200 S is a home with nearby schools including Lincoln School, South Cache Middle School, and Mountain Crest High School.
Ownership History
Date
Name
Owned For
Owner Type
Purchase Details
Closed on
Feb 12, 2014
Sold by
Jenson Kelly Lamar
Bought by
Jenson Kelly Lamar and Kelly Lamar Jenson Revocable Trust
Current Estimated Value
Purchase Details
Closed on
May 17, 2013
Sold by
Brown Fon Ray and Brown Joy Jackson
Bought by
Jenson Kelly Lamar
Home Financials for this Owner
Home Financials are based on the most recent Mortgage that was taken out on this home.
Original Mortgage
$100,000
Outstanding Balance
$70,638
Interest Rate
3.41%
Mortgage Type
Seller Take Back
Estimated Equity
$306,901
Purchase Details
Closed on
Jan 23, 2012
Sold by
Brown Fon Ray and Brown Joy
Bought by
Brown Fon Ray and Brown Joy Jackson
Create a Home Valuation Report for This Property
The Home Valuation Report is an in-depth analysis detailing your home's value as well as a comparison with similar homes in the area
Home Values in the Area
Average Home Value in this Area
Purchase History
| Date | Buyer | Sale Price | Title Company |
|---|---|---|---|
| Jenson Kelly Lamar | -- | None Available | |
| Jenson Kelly Lamar | -- | Hickman Land Title Company | |
| Brown Fon Ray | -- | None Available |
Source: Public Records
Mortgage History
| Date | Status | Borrower | Loan Amount |
|---|---|---|---|
| Open | Jenson Kelly Lamar | $100,000 |
Source: Public Records
Tax History Compared to Growth
Tax History
| Year | Tax Paid | Tax Assessment Tax Assessment Total Assessment is a certain percentage of the fair market value that is determined by local assessors to be the total taxable value of land and additions on the property. | Land | Improvement |
|---|---|---|---|---|
| 2024 | $156 | $208,890 | $0 | $0 |
| 2023 | $1,305 | $167,350 | $0 | $0 |
| 2022 | $1,197 | $147,050 | $0 | $0 |
| 2021 | $1,122 | $212,386 | $74,940 | $137,446 |
| 2020 | $1,017 | $180,668 | $74,940 | $105,728 |
| 2019 | $972 | $162,428 | $56,700 | $105,728 |
| 2018 | $936 | $151,100 | $56,700 | $94,400 |
| 2017 | $799 | $66,935 | $0 | $0 |
| 2016 | $817 | $66,935 | $0 | $0 |
| 2015 | $819 | $66,935 | $0 | $0 |
| 2014 | $804 | $67,210 | $0 | $0 |
| 2013 | -- | $66,780 | $0 | $0 |
Source: Public Records
Map
Nearby Homes