64 W 35th St Holland, MI 49423
Maplewood NeighborhoodEstimated Value: $353,000 - $389,145
3
Beds
1
Bath
1,925
Sq Ft
$192/Sq Ft
Est. Value
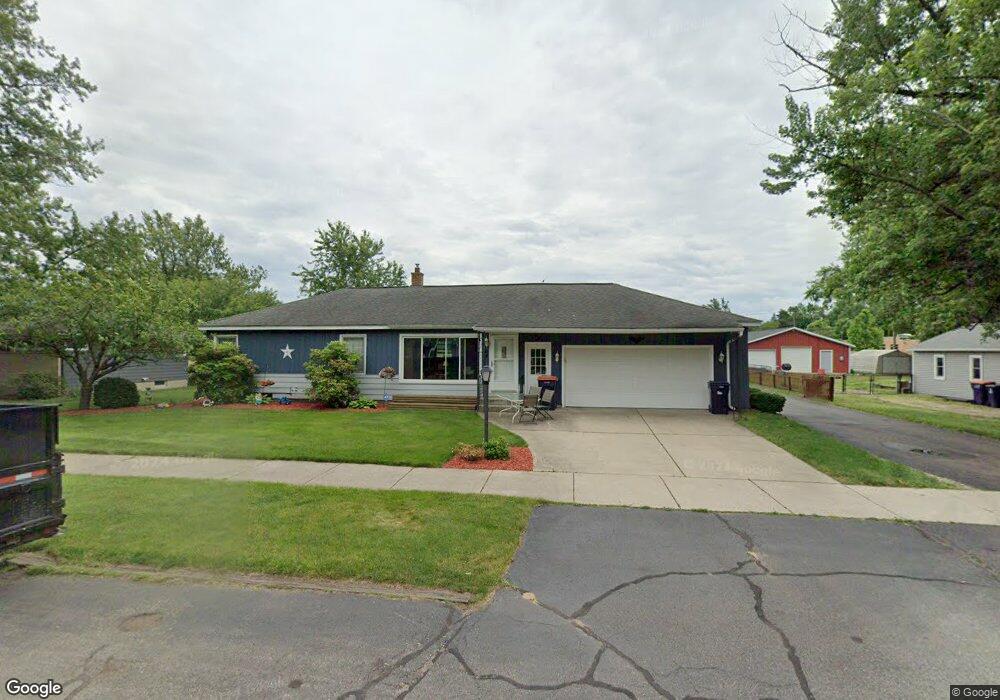
About This Home
This home is located at 64 W 35th St, Holland, MI 49423 and is currently estimated at $370,036, approximately $192 per square foot. 64 W 35th St is a home located in Allegan County with nearby schools including Jefferson Elementary School, Holland High School, and Black River Public School Elementary.
Ownership History
Date
Name
Owned For
Owner Type
Purchase Details
Closed on
Feb 28, 2011
Sold by
Rabbers James and Rabbers Ruth E
Bought by
Maatman Michael
Current Estimated Value
Home Financials for this Owner
Home Financials are based on the most recent Mortgage that was taken out on this home.
Original Mortgage
$112,084
Outstanding Balance
$79,537
Interest Rate
5.5%
Mortgage Type
FHA
Estimated Equity
$290,499
Purchase Details
Closed on
Sep 16, 1993
Sold by
Rabbers James
Create a Home Valuation Report for This Property
The Home Valuation Report is an in-depth analysis detailing your home's value as well as a comparison with similar homes in the area
Home Values in the Area
Average Home Value in this Area
Purchase History
| Date | Buyer | Sale Price | Title Company |
|---|---|---|---|
| Maatman Michael | $115,000 | Clearstream Title | |
| -- | -- | -- |
Source: Public Records
Mortgage History
| Date | Status | Borrower | Loan Amount |
|---|---|---|---|
| Open | Maatman Michael | $112,084 |
Source: Public Records
Tax History Compared to Growth
Tax History
| Year | Tax Paid | Tax Assessment Tax Assessment Total Assessment is a certain percentage of the fair market value that is determined by local assessors to be the total taxable value of land and additions on the property. | Land | Improvement |
|---|---|---|---|---|
| 2025 | $3,030 | $180,500 | $46,300 | $134,200 |
| 2024 | -- | $150,100 | $40,900 | $109,200 |
| 2023 | $2,817 | $134,000 | $34,000 | $100,000 |
| 2022 | $2,689 | $123,000 | $32,700 | $90,300 |
| 2021 | $2,575 | $116,000 | $31,300 | $84,700 |
| 2020 | $2,564 | $99,800 | $25,100 | $74,700 |
| 2019 | $2,441 | $86,500 | $19,600 | $66,900 |
| 2018 | $2,441 | $81,100 | $19,600 | $61,500 |
| 2017 | $0 | $65,000 | $9,900 | $55,100 |
| 2016 | $0 | $65,000 | $9,900 | $55,100 |
| 2015 | -- | $65,000 | $9,900 | $55,100 |
| 2014 | -- | $56,600 | $9,900 | $46,700 |
| 2013 | -- | $53,500 | $9,900 | $43,600 |
Source: Public Records
Map
Nearby Homes
- 817 Central Ave
- 91 W 40th St
- 149 W 32nd St
- 135 W 31st St
- 155 W 31st St
- 81 E 40th St
- 106 E 31st St
- 834 Millbridge Ave Unit 56
- 94 Old Mill Dr Unit 16
- 171 E 37th St
- 860 York Ave
- 199 E 34th St Unit 10
- 202 E 34th St
- 13 W 26th St
- 253 W 28th St
- 1112 Fountain View Cir
- 648 Columbia Ave
- 935 Chelsea Ct
- 195 E 28th St
- 101 E 25th St