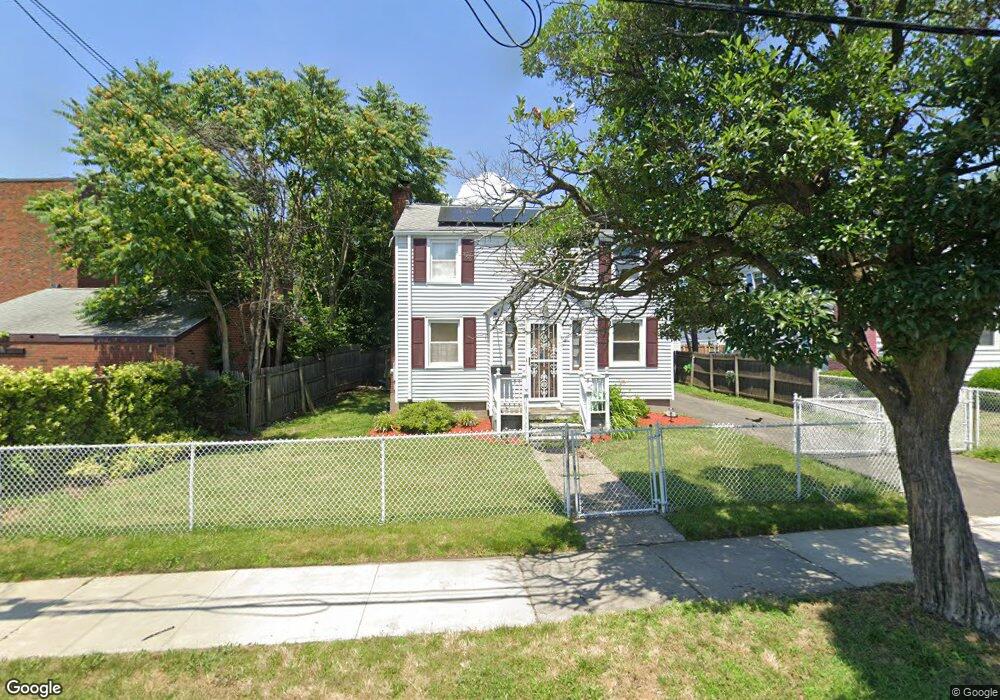
64 Wayland St Hartford, CT 06114
South End NeighborhoodEstimated Value: $194,000 - $264,000
2
Beds
1
Bath
1,135
Sq Ft
$213/Sq Ft
Est. Value
About This Home
This home is located at 64 Wayland St, Hartford, CT 06114 and is currently estimated at $241,994, approximately $213 per square foot. 64 Wayland St is a home located in Hartford County with nearby schools including Asian Studies School At Dwight/Belizzi School, Dr. James H Naylor/Ccsu Leadership Academy, and M. D. Fox School.
Ownership History
Date
Name
Owned For
Owner Type
Purchase Details
Closed on
Feb 24, 2022
Sold by
Franklin Mlc Llc
Bought by
Rivera Carlos
Current Estimated Value
Home Financials for this Owner
Home Financials are based on the most recent Mortgage that was taken out on this home.
Original Mortgage
$104,080
Outstanding Balance
$96,646
Interest Rate
3.55%
Mortgage Type
FHA
Estimated Equity
$145,348
Purchase Details
Closed on
Feb 25, 2011
Sold by
Fnma
Bought by
Franklin Mlc Llc
Purchase Details
Closed on
Feb 8, 2011
Sold by
Nationwide Advantage M
Bought by
Federal National Mortgage Association
Purchase Details
Closed on
Oct 2, 2001
Sold by
Tortoro Louis Est and Bellobuono
Bought by
Dieppa Glorybell
Purchase Details
Closed on
Nov 3, 1987
Sold by
Griffin Joseph
Bought by
Tortoro Louis A
Create a Home Valuation Report for This Property
The Home Valuation Report is an in-depth analysis detailing your home's value as well as a comparison with similar homes in the area
Home Values in the Area
Average Home Value in this Area
Purchase History
| Date | Buyer | Sale Price | Title Company |
|---|---|---|---|
| Rivera Carlos | $106,000 | None Available | |
| Franklin Mlc Llc | $65,000 | -- | |
| Federal National Mortgage Association | -- | -- | |
| Dieppa Glorybell | $82,000 | -- | |
| Tortoro Louis A | $116,000 | -- |
Source: Public Records
Mortgage History
| Date | Status | Borrower | Loan Amount |
|---|---|---|---|
| Open | Rivera Carlos | $104,080 | |
| Previous Owner | Tortoro Louis A | $38,000 | |
| Previous Owner | Tortoro Louis A | $37,512 | |
| Previous Owner | Tortoro Louis A | $144,000 |
Source: Public Records
Tax History Compared to Growth
Tax History
| Year | Tax Paid | Tax Assessment Tax Assessment Total Assessment is a certain percentage of the fair market value that is determined by local assessors to be the total taxable value of land and additions on the property. | Land | Improvement |
|---|---|---|---|---|
| 2025 | $5,243 | $76,036 | $7,093 | $68,943 |
| 2024 | $5,243 | $76,036 | $7,093 | $68,943 |
| 2023 | $5,243 | $76,036 | $7,093 | $68,943 |
| 2022 | $3,783 | $76,036 | $7,093 | $68,943 |
| 2021 | $3,783 | $50,925 | $9,415 | $41,510 |
| 2020 | $3,783 | $50,925 | $9,415 | $41,510 |
| 2019 | $3,783 | $50,925 | $9,415 | $41,510 |
| 2018 | $3,656 | $49,208 | $9,097 | $40,111 |
| 2016 | $3,544 | $47,703 | $8,664 | $39,039 |
| 2015 | $3,376 | $45,437 | $8,253 | $37,184 |
| 2014 | $3,293 | $44,326 | $8,051 | $36,275 |
Source: Public Records
Map
Nearby Homes
- 61 Preston St Unit 63
- 147 Preston St Unit 1
- 183 Preston St Unit 185
- 152 Otis St
- 167 Campfield Ave
- 17 Bond St
- 15 Bond St
- 839 Wethersfield Ave
- 213 Franklin Ave Unit 405
- 281 Brown St
- 356 Wethersfield Ave
- 10 Warner St
- 49 Benton St
- 326 South St Unit 328
- 69 Mountford St Unit 3A
- 73 Mountford St Unit 3B
- 77 Mountford St
- 126 Tredeau St
- 30 Shultas Place Unit 32
- 90 Harwich St Unit 92
- 60 Wayland St
- 56 Wayland St
- 59 Bodwell St Unit 61
- 420 Franklin Ave
- 412 Franklin Ave Unit A04
- 412 Franklin Ave Unit A-9
- 412 Franklin Ave Unit A-10
- 412 Franklin Ave Unit C-2
- 412 Franklin Ave
- 55 Bodwell St Unit 57
- 52 Wayland St
- 59 Wayland St
- 61 Wayland St
- 51 Bodwell St Unit 53
- 416 Franklin Ave Unit A04
- 416 Franklin Ave
- 55 Wayland St
- 65 Wayland St
- 48 Wayland St
- 47 Bodwell St Unit 49