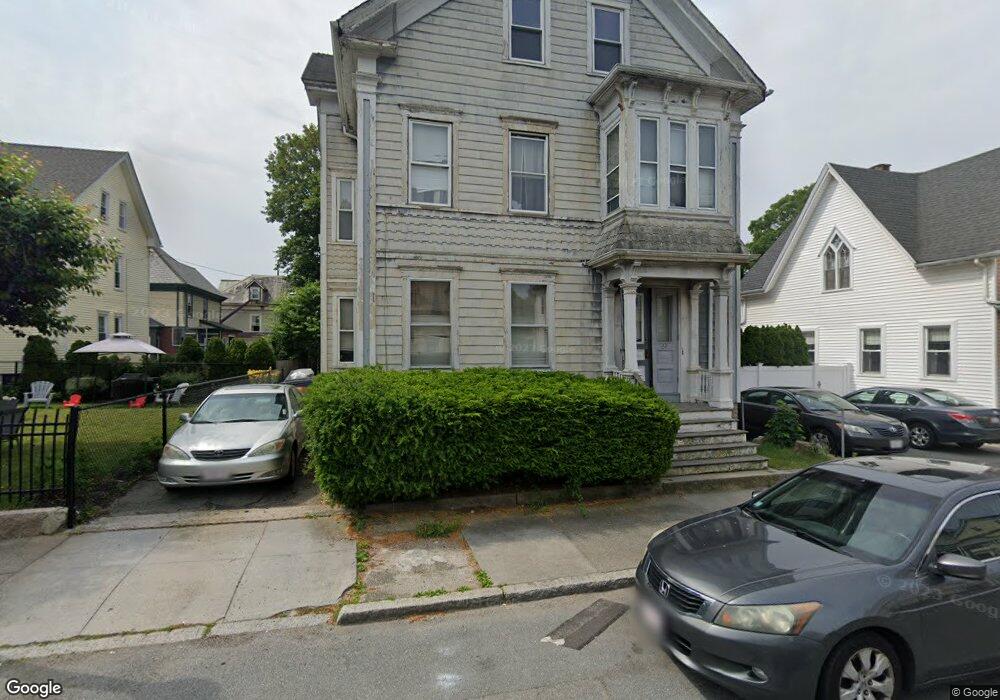
64 Willis St New Bedford, MA 02740
Downtown New Bedford NeighborhoodEstimated Value: $540,060 - $626,000
4
Beds
3
Baths
3,337
Sq Ft
$174/Sq Ft
Est. Value
About This Home
This home is located at 64 Willis St, New Bedford, MA 02740 and is currently estimated at $581,765, approximately $174 per square foot. 64 Willis St is a home located in Bristol County with nearby schools including John Avery Parker, Keith Middle School, and New Bedford High School.
Ownership History
Date
Name
Owned For
Owner Type
Purchase Details
Closed on
May 24, 2004
Sold by
Vermette Mark J
Bought by
Vermette Pamela C
Current Estimated Value
Purchase Details
Closed on
Apr 22, 1994
Sold by
Ramsay Scott P and Rodrigues Maria M A
Bought by
Vermette Mark J and Vermette Pamela C
Purchase Details
Closed on
Mar 25, 1991
Sold by
Est Miller Benjamin C
Bought by
Ramsay Scott P and Rodrigues Maria M A
Create a Home Valuation Report for This Property
The Home Valuation Report is an in-depth analysis detailing your home's value as well as a comparison with similar homes in the area
Home Values in the Area
Average Home Value in this Area
Purchase History
| Date | Buyer | Sale Price | Title Company |
|---|---|---|---|
| Vermette Pamela C | -- | -- | |
| Vermette Pamela C | -- | -- | |
| Vermette Mark J | $103,000 | -- | |
| Vermette Mark J | $103,000 | -- | |
| Ramsay Scott P | $104,000 | -- | |
| Ramsay Scott P | $104,000 | -- |
Source: Public Records
Mortgage History
| Date | Status | Borrower | Loan Amount |
|---|---|---|---|
| Open | Ramsay Scott P | $253,910 | |
| Closed | Ramsay Scott P | $220,000 |
Source: Public Records
Tax History Compared to Growth
Tax History
| Year | Tax Paid | Tax Assessment Tax Assessment Total Assessment is a certain percentage of the fair market value that is determined by local assessors to be the total taxable value of land and additions on the property. | Land | Improvement |
|---|---|---|---|---|
| 2025 | $5,708 | $504,700 | $86,800 | $417,900 |
| 2024 | $5,066 | $422,200 | $74,100 | $348,100 |
| 2023 | $4,754 | $332,700 | $62,100 | $270,600 |
| 2022 | $4,242 | $273,000 | $56,800 | $216,200 |
| 2021 | $4,256 | $273,000 | $56,800 | $216,200 |
| 2020 | $4,067 | $251,700 | $56,800 | $194,900 |
| 2019 | $3,951 | $239,900 | $56,800 | $183,100 |
| 2018 | $3,705 | $222,800 | $56,800 | $166,000 |
| 2017 | $3,303 | $197,900 | $56,800 | $141,100 |
| 2016 | $3,166 | $192,000 | $56,800 | $135,200 |
| 2015 | $2,953 | $187,700 | $56,800 | $130,900 |
| 2014 | $2,856 | $188,400 | $56,800 | $131,600 |
Source: Public Records
Map
Nearby Homes