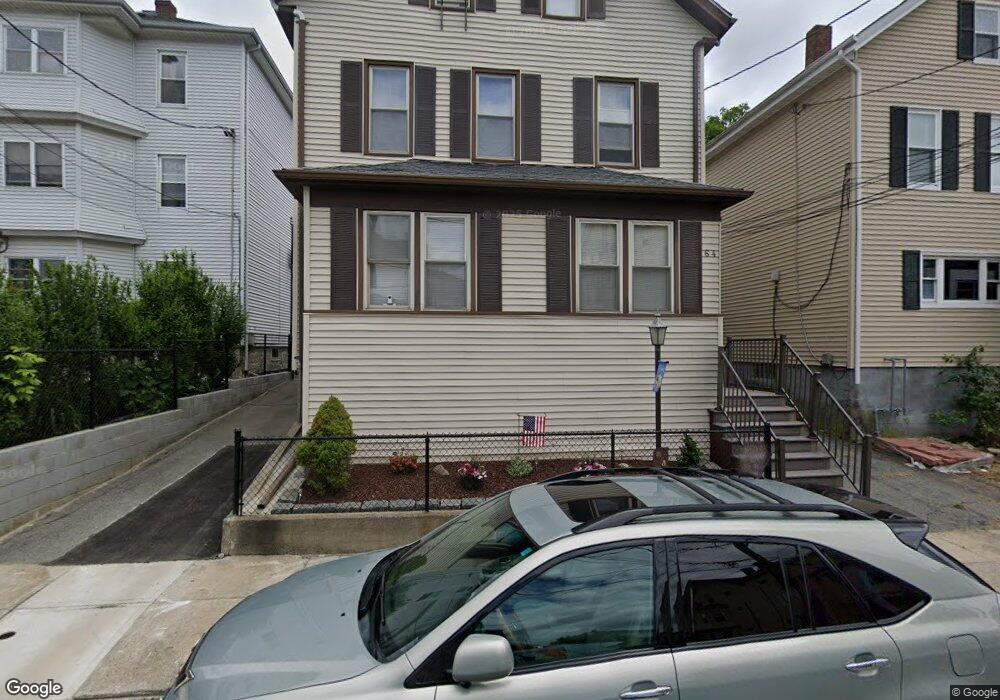
64 Wooley St Fall River, MA 02724
Father Kelly NeighborhoodEstimated Value: $382,876 - $556,000
5
Beds
3
Baths
1,680
Sq Ft
$278/Sq Ft
Est. Value
About This Home
This home is located at 64 Wooley St, Fall River, MA 02724 and is currently estimated at $467,219, approximately $278 per square foot. 64 Wooley St is a home located in Bristol County with nearby schools including Henry Lord Community School, B M C Durfee High School, and Argosy Collegiate Charter School.
Ownership History
Date
Name
Owned For
Owner Type
Purchase Details
Closed on
Nov 3, 2017
Sold by
Lyne Daniel M and Lyne Delores
Bought by
Lyne Cory
Current Estimated Value
Home Financials for this Owner
Home Financials are based on the most recent Mortgage that was taken out on this home.
Original Mortgage
$114,163
Outstanding Balance
$93,666
Interest Rate
3.87%
Mortgage Type
FHA
Estimated Equity
$373,553
Purchase Details
Closed on
Jun 25, 1976
Bought by
Lyne Daniel M and Lyne Delores
Create a Home Valuation Report for This Property
The Home Valuation Report is an in-depth analysis detailing your home's value as well as a comparison with similar homes in the area
Home Values in the Area
Average Home Value in this Area
Purchase History
| Date | Buyer | Sale Price | Title Company |
|---|---|---|---|
| Lyne Cory | $132,000 | -- | |
| Lyne Daniel M | -- | -- |
Source: Public Records
Mortgage History
| Date | Status | Borrower | Loan Amount |
|---|---|---|---|
| Open | Lyne Cory | $114,163 | |
| Previous Owner | Lyne Daniel M | $45,000 | |
| Previous Owner | Lyne Daniel M | $30,000 |
Source: Public Records
Tax History
| Year | Tax Paid | Tax Assessment Tax Assessment Total Assessment is a certain percentage of the fair market value that is determined by local assessors to be the total taxable value of land and additions on the property. | Land | Improvement |
|---|---|---|---|---|
| 2025 | $4,157 | $363,100 | $106,200 | $256,900 |
| 2024 | $3,822 | $332,600 | $102,300 | $230,300 |
| 2023 | $3,438 | $280,200 | $84,500 | $195,700 |
| 2022 | $3,203 | $253,800 | $80,500 | $173,300 |
| 2021 | $2,989 | $216,100 | $76,600 | $139,500 |
| 2020 | $2,719 | $188,200 | $75,500 | $112,700 |
| 2019 | $2,589 | $177,600 | $72,700 | $104,900 |
| 2018 | $2,509 | $171,600 | $78,700 | $92,900 |
| 2017 | $2,283 | $163,100 | $75,000 | $88,100 |
| 2016 | $2,261 | $165,900 | $79,800 | $86,100 |
| 2015 | $2,170 | $165,900 | $79,800 | $86,100 |
| 2014 | $2,147 | $170,700 | $77,500 | $93,200 |
Source: Public Records
Map
Nearby Homes
Your Personal Tour Guide
Ask me questions while you tour the home.