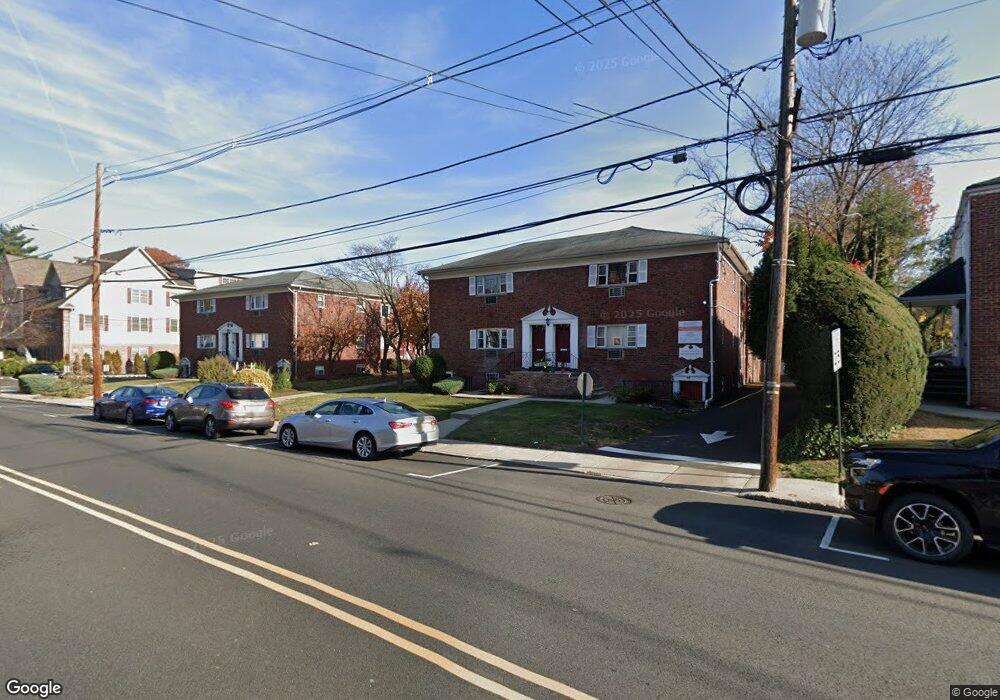
640 Franklin Ave Unit 2C Nutley, NJ 07110
Estimated Value: $235,000 - $281,000
--
Bed
--
Bath
624
Sq Ft
$411/Sq Ft
Est. Value
About This Home
This home is located at 640 Franklin Ave Unit 2C, Nutley, NJ 07110 and is currently estimated at $256,695, approximately $411 per square foot. 640 Franklin Ave Unit 2C is a home located in Essex County with nearby schools including Nutley High School, St Clare Elementary School, and Abundant Life Academy.
Ownership History
Date
Name
Owned For
Owner Type
Purchase Details
Closed on
Oct 18, 2007
Sold by
Elzer Lisa Marie
Bought by
Walsh Tara
Current Estimated Value
Home Financials for this Owner
Home Financials are based on the most recent Mortgage that was taken out on this home.
Original Mortgage
$16,400
Outstanding Balance
$10,403
Interest Rate
6.43%
Mortgage Type
Stand Alone Second
Estimated Equity
$246,292
Purchase Details
Closed on
Nov 17, 2003
Sold by
Stager Brad
Bought by
Elzer Lisa Marie
Home Financials for this Owner
Home Financials are based on the most recent Mortgage that was taken out on this home.
Original Mortgage
$113,400
Interest Rate
5.9%
Purchase Details
Closed on
Sep 28, 2001
Sold by
Navitski Edward
Bought by
Stager Brad
Home Financials for this Owner
Home Financials are based on the most recent Mortgage that was taken out on this home.
Original Mortgage
$58,000
Interest Rate
6.92%
Create a Home Valuation Report for This Property
The Home Valuation Report is an in-depth analysis detailing your home's value as well as a comparison with similar homes in the area
Home Values in the Area
Average Home Value in this Area
Purchase History
| Date | Buyer | Sale Price | Title Company |
|---|---|---|---|
| Walsh Tara | $182,000 | Land Title Agency Inc | |
| Elzer Lisa Marie | $126,000 | -- | |
| Stager Brad | $85,000 | -- |
Source: Public Records
Mortgage History
| Date | Status | Borrower | Loan Amount |
|---|---|---|---|
| Open | Walsh Tara | $16,400 | |
| Open | Walsh Tara | $145,600 | |
| Previous Owner | Elzer Lisa Marie | $113,400 | |
| Previous Owner | Stager Brad | $58,000 |
Source: Public Records
Tax History Compared to Growth
Tax History
| Year | Tax Paid | Tax Assessment Tax Assessment Total Assessment is a certain percentage of the fair market value that is determined by local assessors to be the total taxable value of land and additions on the property. | Land | Improvement |
|---|---|---|---|---|
| 2025 | $4,907 | $190,500 | $70,000 | $120,500 |
| 2024 | $4,907 | $190,500 | $70,000 | $120,500 |
| 2022 | $4,177 | $108,100 | $48,000 | $60,100 |
| 2021 | $4,155 | $108,100 | $48,000 | $60,100 |
| 2020 | $3,980 | $108,100 | $48,000 | $60,100 |
| 2019 | $3,900 | $108,100 | $48,000 | $60,100 |
| 2018 | $3,795 | $108,100 | $48,000 | $60,100 |
| 2017 | $3,754 | $108,100 | $48,000 | $60,100 |
| 2016 | $3,643 | $108,100 | $48,000 | $60,100 |
| 2015 | $3,585 | $108,100 | $48,000 | $60,100 |
| 2014 | $3,539 | $108,100 | $48,000 | $60,100 |
Source: Public Records
Map
Nearby Homes
- 640 Franklin Ave Unit 2
- 20 Saint Pauls Place
- 307 Hillside Ave
- 7 Yantacaw Place
- 97 Glendale St
- 274 Kingsland St
- 688 Passaic Ave
- 18 Brookfield Ave
- 17 Princeton St
- 11 Wharton Ave
- 68 Cathedral Ave
- 36 Lake St
- 63 Lakeside Dr
- 51 Kensington Ave
- 564 Bloomfield Ave
- 585 Bloomfield Ave
- 6-12 Hillside Ave
- 6-12 Hillside Ave Unit 2-G
- 83 Raymond Ave
- 18 Stockton Place
- 640 Franklin Ave Unit 1M
- 640 Franklin Ave Unit D
- 640 Franklin Ave Unit L2
- 640 Franklin Ave Unit BB
- 640 Franklin Ave Unit J1
- 640 Franklin Ave Unit B-1
- 640 Franklin Ave Unit 2E
- 640 Franklin Ave Unit K-1
- 640 Franklin Ave Unit 2P
- 640 Franklin Ave Unit 1R
- 640 Franklin Ave Unit 2R
- 640 Franklin Ave Unit 1P
- 640 Franklin Ave Unit 2M
- 640 Franklin Ave Unit 1M
- 640 Franklin Ave Unit 1C
- 640 Franklin Ave Unit 2B
- 640 Franklin Ave Unit 1B
- 640 Franklin Ave Unit 2A
- 640 Franklin Ave Unit 1L
- 640 Franklin Ave Unit 2K