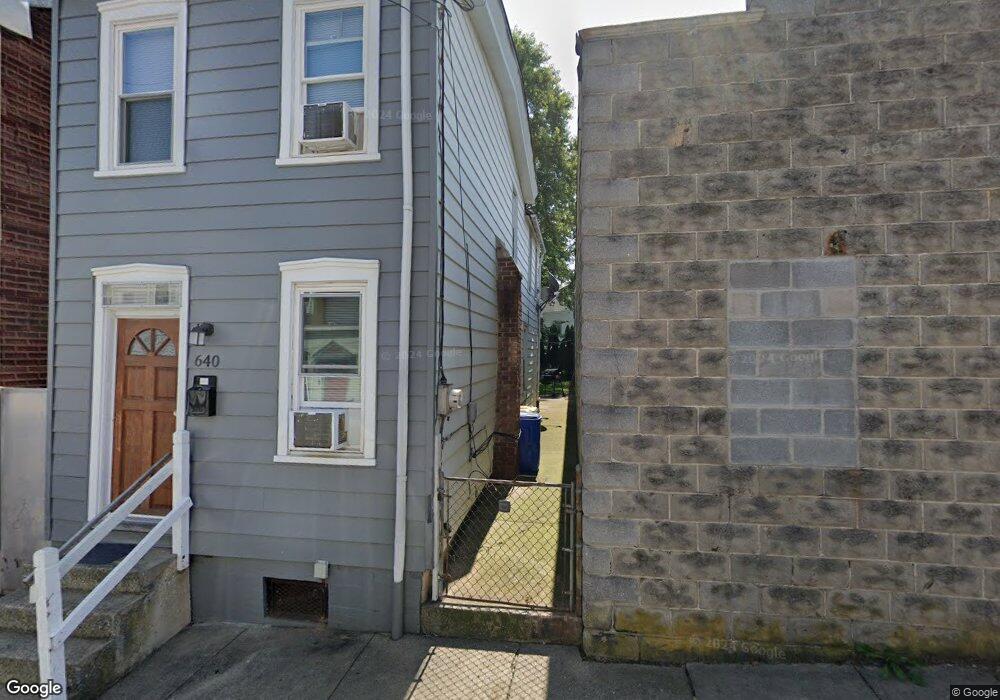
640 High St Lancaster, PA 17603
Cabbage Hill NeighborhoodEstimated Value: $163,000 - $185,000
2
Beds
1
Bath
990
Sq Ft
$178/Sq Ft
Est. Value
About This Home
This home is located at 640 High St, Lancaster, PA 17603 and is currently estimated at $175,791, approximately $177 per square foot. 640 High St is a home located in Lancaster County with nearby schools including Price Elementary School, Jackson Middle School, and McCaskey High School.
Ownership History
Date
Name
Owned For
Owner Type
Purchase Details
Closed on
Jan 3, 2019
Sold by
Jjz Properties Lp
Bought by
Martin Jaylan
Current Estimated Value
Home Financials for this Owner
Home Financials are based on the most recent Mortgage that was taken out on this home.
Original Mortgage
$105,000
Outstanding Balance
$92,145
Interest Rate
4.8%
Mortgage Type
Future Advance Clause Open End Mortgage
Estimated Equity
$83,646
Purchase Details
Closed on
Jun 22, 2012
Sold by
Underwood Douglas L and Underwood Melissa L
Bought by
Jjz Properties Lp
Purchase Details
Closed on
Apr 3, 2002
Sold by
Pichler Mary A
Bought by
Underwood Douglas L and Underwood Melissa L
Home Financials for this Owner
Home Financials are based on the most recent Mortgage that was taken out on this home.
Original Mortgage
$40,000
Interest Rate
6.85%
Create a Home Valuation Report for This Property
The Home Valuation Report is an in-depth analysis detailing your home's value as well as a comparison with similar homes in the area
Home Values in the Area
Average Home Value in this Area
Purchase History
| Date | Buyer | Sale Price | Title Company |
|---|---|---|---|
| Martin Jaylan | $102,000 | None Available | |
| Jjz Properties Lp | $26,500 | None Available | |
| Underwood Douglas L | $50,000 | -- |
Source: Public Records
Mortgage History
| Date | Status | Borrower | Loan Amount |
|---|---|---|---|
| Open | Martin Jaylan | $105,000 | |
| Previous Owner | Underwood Douglas L | $40,000 |
Source: Public Records
Tax History
| Year | Tax Paid | Tax Assessment Tax Assessment Total Assessment is a certain percentage of the fair market value that is determined by local assessors to be the total taxable value of land and additions on the property. | Land | Improvement |
|---|---|---|---|---|
| 2025 | $1,994 | $50,400 | $12,500 | $37,900 |
| 2024 | $1,994 | $50,400 | $12,500 | $37,900 |
| 2023 | $1,961 | $50,400 | $12,500 | $37,900 |
| 2022 | $1,879 | $50,400 | $12,500 | $37,900 |
| 2021 | $1,839 | $50,400 | $12,500 | $37,900 |
| 2020 | $1,839 | $50,400 | $12,500 | $37,900 |
| 2018 | $2,110 | $50,400 | $12,500 | $37,900 |
| 2017 | $2,366 | $51,500 | $13,200 | $38,300 |
| 2016 | $2,344 | $51,500 | $13,200 | $38,300 |
| 2015 | $914 | $51,500 | $13,200 | $38,300 |
| 2014 | $2,046 | $51,500 | $13,200 | $38,300 |
Source: Public Records
Map
Nearby Homes
Your Personal Tour Guide
Ask me questions while you tour the home.