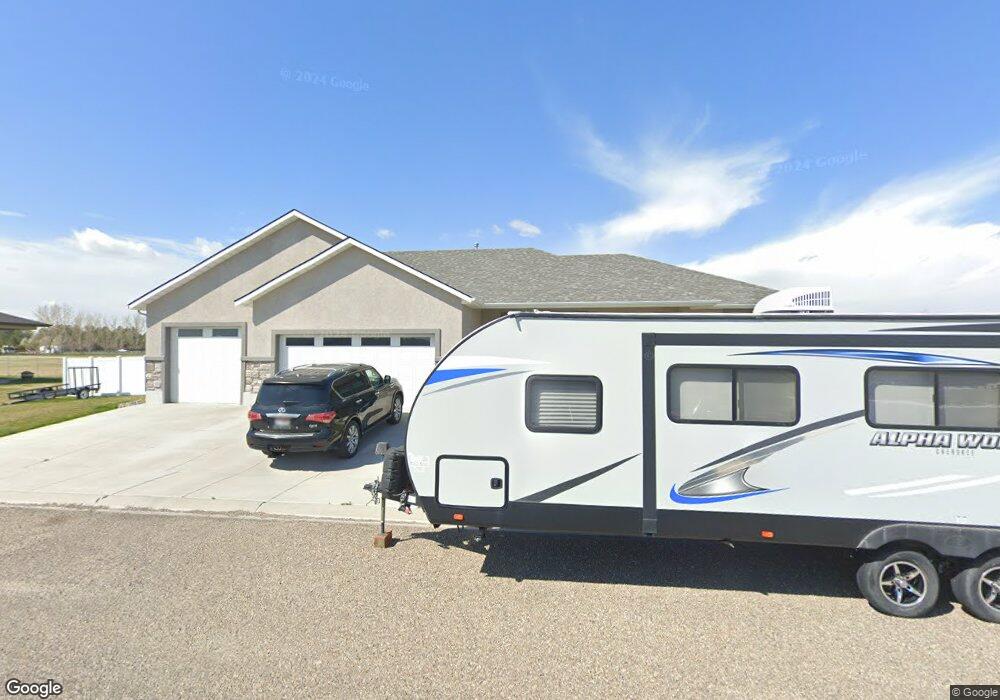
640 Lochsa Loop Heyburn, ID 83336
Estimated Value: $576,349 - $652,000
6
Beds
3
Baths
3,406
Sq Ft
$179/Sq Ft
Est. Value
About This Home
This home is located at 640 Lochsa Loop, Heyburn, ID 83336 and is currently estimated at $609,087, approximately $178 per square foot. 640 Lochsa Loop is a home with nearby schools including Heyburn Elementary School and Minico Senior High School.
Ownership History
Date
Name
Owned For
Owner Type
Purchase Details
Closed on
Jun 19, 2017
Sold by
Smith Nicholas W and Smith Tina M
Bought by
Steel Tyson and Steel Jana
Current Estimated Value
Home Financials for this Owner
Home Financials are based on the most recent Mortgage that was taken out on this home.
Original Mortgage
$324,950
Outstanding Balance
$270,291
Interest Rate
4.02%
Mortgage Type
New Conventional
Estimated Equity
$338,796
Purchase Details
Closed on
Mar 27, 2014
Sold by
Blue River Properties Inc
Bought by
Smith Nicholas W and Smith Tina M
Create a Home Valuation Report for This Property
The Home Valuation Report is an in-depth analysis detailing your home's value as well as a comparison with similar homes in the area
Home Values in the Area
Average Home Value in this Area
Purchase History
| Date | Buyer | Sale Price | Title Company |
|---|---|---|---|
| Steel Tyson | -- | Titleone Burley | |
| Smith Nicholas W | -- | Rupert Land Title |
Source: Public Records
Mortgage History
| Date | Status | Borrower | Loan Amount |
|---|---|---|---|
| Open | Steel Tyson | $324,950 |
Source: Public Records
Tax History
| Year | Tax Paid | Tax Assessment Tax Assessment Total Assessment is a certain percentage of the fair market value that is determined by local assessors to be the total taxable value of land and additions on the property. | Land | Improvement |
|---|---|---|---|---|
| 2025 | $3,782 | $566,764 | $48,514 | $518,250 |
| 2024 | $3,903 | $566,764 | $48,514 | $518,250 |
| 2023 | $2,966 | $529,814 | $48,514 | $481,300 |
| 2022 | $4,031 | $503,321 | $44,131 | $459,190 |
| 2021 | $3,445 | $390,687 | $33,457 | $357,230 |
| 2020 | $3,455 | $357,103 | $25,623 | $331,480 |
| 2019 | $3,429 | $340,773 | $0 | $0 |
| 2018 | $3,248 | $320,723 | $25,623 | $295,100 |
| 2017 | $3,380 | $337,900 | $20,700 | $317,200 |
| 2016 | $2,607 | $94,745 | $0 | $0 |
| 2015 | -- | $0 | $0 | $0 |
| 2014 | -- | $0 | $0 | $0 |
| 2012 | -- | $0 | $0 | $0 |
Source: Public Records
Map
Nearby Homes
Your Personal Tour Guide
Ask me questions while you tour the home.