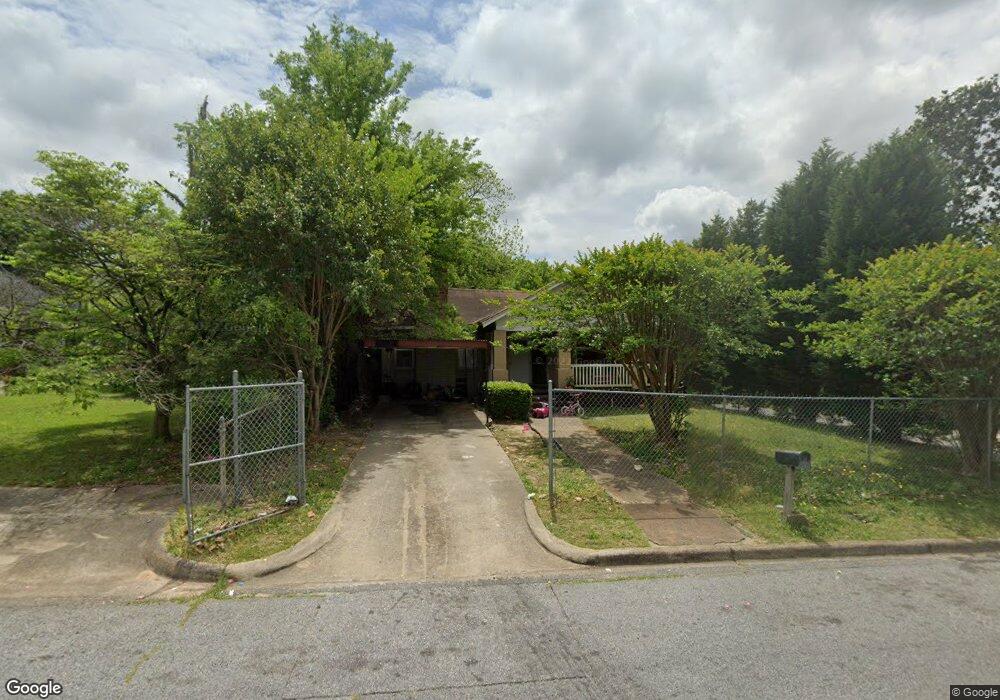
640 Lynmore Ave Macon, GA 31206
Estimated Value: $96,000 - $124,000
4
Beds
2
Baths
1,738
Sq Ft
$63/Sq Ft
Est. Value
About This Home
This home is located at 640 Lynmore Ave, Macon, GA 31206 and is currently estimated at $109,468, approximately $62 per square foot. 640 Lynmore Ave is a home located in Bibb County with nearby schools including Bruce Elementary School, Rutland Middle School, and Rutland High School.
Ownership History
Date
Name
Owned For
Owner Type
Purchase Details
Closed on
Feb 24, 2011
Sold by
Navy Federal Credit Union
Bought by
Holloway Tiffany and Collins Cheryl
Current Estimated Value
Purchase Details
Closed on
Feb 18, 2011
Sold by
Navy Federal Credit Union
Bought by
Collins Cheryl and Holloway Tiffany
Purchase Details
Closed on
Oct 5, 2010
Sold by
Means Eric
Bought by
Navy Federal Credit Union
Purchase Details
Closed on
Mar 23, 2007
Sold by
Tbrown & Co Llc
Bought by
Means Eric
Purchase Details
Closed on
Mar 22, 2007
Sold by
Federal National Mortgage Association
Bought by
Brown And Company Llc
Purchase Details
Closed on
Nov 7, 2006
Bought by
Means Eric
Purchase Details
Closed on
Dec 20, 2002
Purchase Details
Closed on
Jan 29, 2002
Create a Home Valuation Report for This Property
The Home Valuation Report is an in-depth analysis detailing your home's value as well as a comparison with similar homes in the area
Home Values in the Area
Average Home Value in this Area
Purchase History
| Date | Buyer | Sale Price | Title Company |
|---|---|---|---|
| Holloway Tiffany | -- | -- | |
| Collins Cheryl | $8,500 | None Available | |
| Navy Federal Credit Union | $30,400 | -- | |
| Navy Federal Credit Union | $30,360 | None Available | |
| Means Eric | $54,000 | -- | |
| Brown And Company Llc | -- | None Available | |
| Means Eric | $56,400 | -- | |
| -- | $60,000 | -- | |
| -- | $51,000 | -- |
Source: Public Records
Tax History Compared to Growth
Tax History
| Year | Tax Paid | Tax Assessment Tax Assessment Total Assessment is a certain percentage of the fair market value that is determined by local assessors to be the total taxable value of land and additions on the property. | Land | Improvement |
|---|---|---|---|---|
| 2025 | $927 | $37,731 | $2,800 | $34,931 |
| 2024 | $917 | $36,102 | $2,800 | $33,302 |
| 2023 | $917 | $36,102 | $2,800 | $33,302 |
| 2022 | $759 | $21,919 | $1,198 | $20,721 |
| 2021 | $503 | $13,250 | $1,078 | $12,172 |
| 2020 | $443 | $11,401 | $1,078 | $10,323 |
| 2019 | $446 | $11,401 | $1,078 | $10,323 |
| 2018 | $780 | $10,007 | $839 | $9,168 |
| 2017 | $375 | $10,007 | $839 | $9,168 |
| 2016 | $346 | $10,007 | $839 | $9,168 |
| 2015 | $547 | $11,162 | $839 | $10,323 |
| 2014 | $1,015 | $18,017 | $958 | $17,058 |
Source: Public Records
Map
Nearby Homes
- 624 Lynmore Ave
- 658 Lynmore Ave
- 670 Lynmore Ave
- 3825 Flamingo Dr
- 608 Lynmore Ave
- 631 Lynmore Ave
- 3845 Flamingo Dr
- 682 Lynmore Ave
- 645 Lynmore Ave
- 637 Moreland Ave
- 649 Moreland Ave
- 3791 Flamingo Dr
- 657 Moreland Ave
- 659 Lynmore Ave
- 3832 San Juan Ave
- 3865 Flamingo Dr
- 671 Lynmore Ave
- 677 Moreland Ave
- 3769 Flamingo Dr
- 694 Lynmore Ave