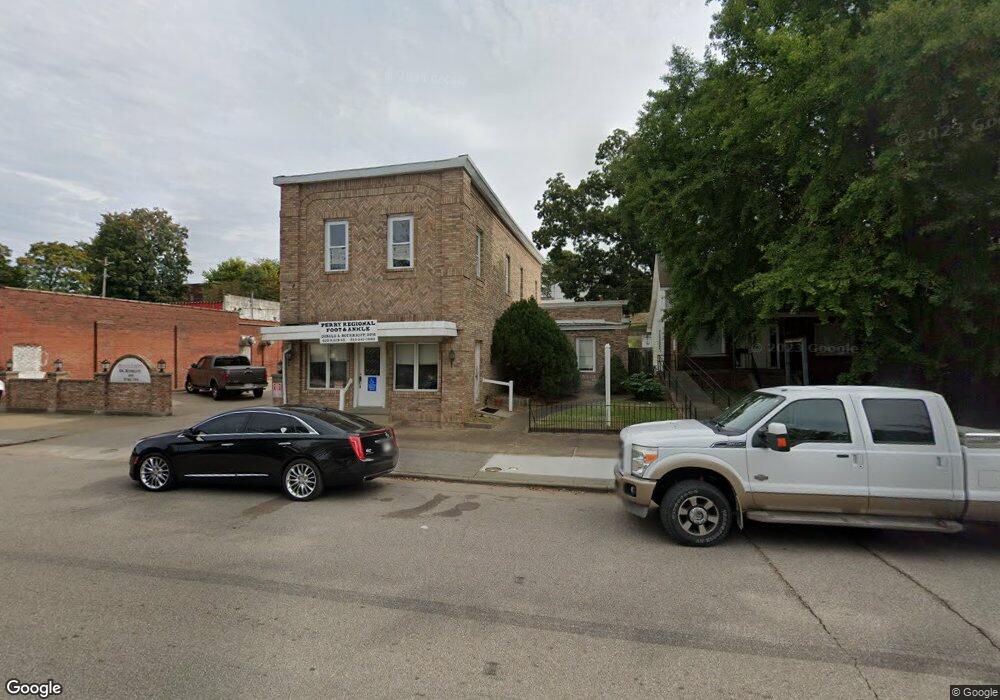
640 Main St Tell City, IN 47586
Estimated Value: $114,837
--
Bed
--
Bath
7,500
Sq Ft
$15/Sq Ft
Est. Value
About This Home
This home is located at 640 Main St, Tell City, IN 47586 and is currently priced at $114,837, approximately $15 per square foot. 640 Main St is a home located in Perry County with nearby schools including William Tell Elementary School, Tell City Junior/Senior High School, and Agape Christian Academy.
Ownership History
Date
Name
Owned For
Owner Type
Purchase Details
Closed on
Dec 27, 2023
Sold by
Cail Christopher
Bought by
Tell City Chair Gallery Llc
Current Estimated Value
Purchase Details
Closed on
Sep 20, 2018
Sold by
Casebolt Joshua D
Bought by
Christoher Cail
Home Financials for this Owner
Home Financials are based on the most recent Mortgage that was taken out on this home.
Original Mortgage
$100,000
Interest Rate
4%
Mortgage Type
Commercial
Purchase Details
Closed on
Jan 22, 2014
Sold by
Gabc Holdings Inc
Bought by
Casebolt Rentals Llc
Purchase Details
Closed on
Apr 4, 2013
Sold by
Custom Enterprises Llc
Bought by
Gabc Holdings Inc
Create a Home Valuation Report for This Property
The Home Valuation Report is an in-depth analysis detailing your home's value as well as a comparison with similar homes in the area
Home Values in the Area
Average Home Value in this Area
Purchase History
| Date | Buyer | Sale Price | Title Company |
|---|---|---|---|
| Tell City Chair Gallery Llc | -- | None Listed On Document | |
| Christoher Cail | $76,500 | -- | |
| Cail Christopher | $76,500 | Bosse Title Company | |
| Casebolt Rentals Llc | -- | None Available | |
| Gabc Holdings Inc | -- | None Available |
Source: Public Records
Mortgage History
| Date | Status | Borrower | Loan Amount |
|---|---|---|---|
| Previous Owner | Cail Christopher | $100,000 |
Source: Public Records
Tax History Compared to Growth
Tax History
| Year | Tax Paid | Tax Assessment Tax Assessment Total Assessment is a certain percentage of the fair market value that is determined by local assessors to be the total taxable value of land and additions on the property. | Land | Improvement |
|---|---|---|---|---|
| 2024 | $1,908 | $63,600 | $27,400 | $36,200 |
| 2023 | $1,881 | $62,700 | $27,400 | $35,300 |
| 2022 | $1,745 | $59,200 | $27,400 | $31,800 |
| 2021 | $2,244 | $110,700 | $27,400 | $83,300 |
| 2020 | $2,199 | $73,300 | $27,400 | $45,900 |
| 2019 | $2,199 | $73,300 | $27,400 | $45,900 |
| 2018 | $2,205 | $73,500 | $27,100 | $46,400 |
| 2017 | $2,175 | $72,500 | $27,100 | $45,400 |
| 2016 | $2,202 | $73,400 | $27,100 | $46,300 |
| 2014 | $2,208 | $73,600 | $27,100 | $46,500 |
| 2013 | $2,208 | $77,400 | $27,200 | $50,200 |
Source: Public Records
Map
Nearby Homes