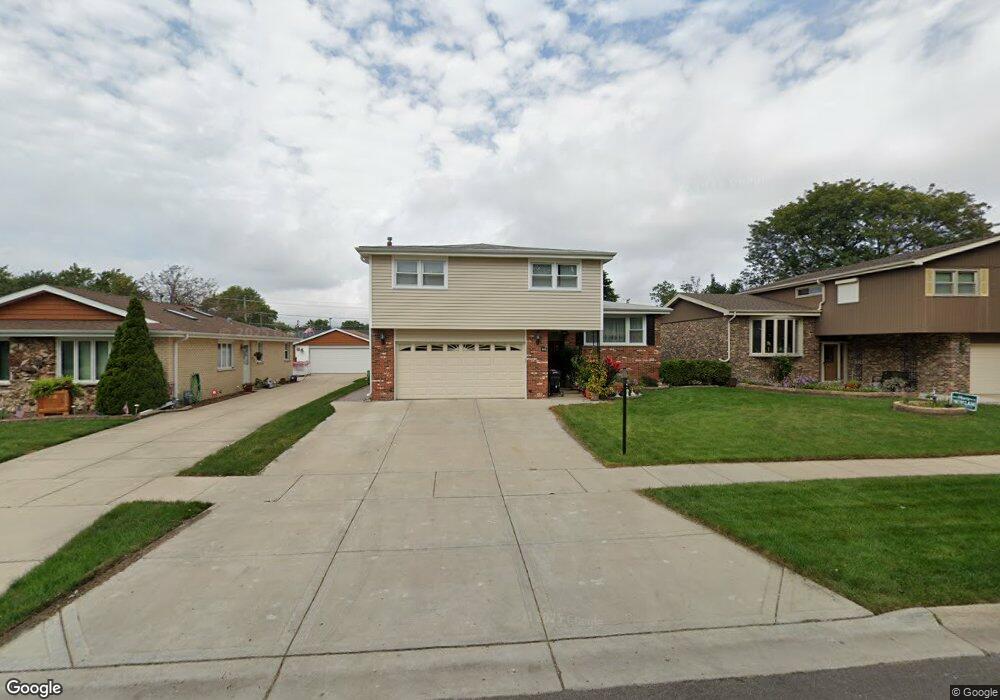
640 Morray Ct Des Plaines, IL 60018
Estimated Value: $507,669 - $592,000
4
Beds
3
Baths
2,539
Sq Ft
$216/Sq Ft
Est. Value
About This Home
This home is located at 640 Morray Ct, Des Plaines, IL 60018 and is currently estimated at $548,417, approximately $215 per square foot. 640 Morray Ct is a home located in Cook County with nearby schools including Devonshire Elementary School, Friendship Jr High School, and Elk Grove High School.
Ownership History
Date
Name
Owned For
Owner Type
Purchase Details
Closed on
Feb 17, 2021
Sold by
Chicago Title Land Trust Company
Bought by
Intile Giovanni and Intile Giovanni Revocable
Current Estimated Value
Purchase Details
Closed on
Jan 30, 2003
Sold by
Intile Giovanni and Intile Rosaria
Bought by
The Chicago Trust Co and Trust #1112001
Purchase Details
Closed on
Apr 18, 1997
Sold by
Schaffrath Margaret F and Schaffrath Henry P
Bought by
Intile Giovanni and Intile Rosaria
Home Financials for this Owner
Home Financials are based on the most recent Mortgage that was taken out on this home.
Original Mortgage
$90,000
Interest Rate
8%
Create a Home Valuation Report for This Property
The Home Valuation Report is an in-depth analysis detailing your home's value as well as a comparison with similar homes in the area
Home Values in the Area
Average Home Value in this Area
Purchase History
| Date | Buyer | Sale Price | Title Company |
|---|---|---|---|
| Intile Giovanni | -- | None Available | |
| The Chicago Trust Co | -- | -- | |
| The Chicago Trust Co | -- | -- | |
| Intile Giovanni | $225,000 | Heritage Title Company |
Source: Public Records
Mortgage History
| Date | Status | Borrower | Loan Amount |
|---|---|---|---|
| Previous Owner | Intile Giovanni | $90,000 |
Source: Public Records
Tax History
| Year | Tax Paid | Tax Assessment Tax Assessment Total Assessment is a certain percentage of the fair market value that is determined by local assessors to be the total taxable value of land and additions on the property. | Land | Improvement |
|---|---|---|---|---|
| 2025 | $7,828 | $50,000 | $8,433 | $41,567 |
| 2024 | $7,828 | $36,863 | $7,228 | $29,635 |
| 2023 | $7,439 | $36,863 | $7,228 | $29,635 |
| 2022 | $7,439 | $36,863 | $7,228 | $29,635 |
| 2021 | $7,114 | $28,934 | $4,818 | $24,116 |
| 2020 | $7,020 | $28,934 | $4,818 | $24,116 |
| 2019 | $7,100 | $32,149 | $4,818 | $27,331 |
| 2018 | $7,698 | $30,979 | $4,015 | $26,964 |
| 2017 | $7,574 | $30,979 | $4,015 | $26,964 |
| 2016 | $7,352 | $30,979 | $4,015 | $26,964 |
| 2015 | $7,465 | $29,715 | $3,613 | $26,102 |
| 2014 | $7,397 | $29,715 | $3,613 | $26,102 |
| 2013 | $7,223 | $29,715 | $3,613 | $26,102 |
Source: Public Records
Map
Nearby Homes
- 1105 Holiday Ln Unit 20
- 1044 Willson Dr
- 725 Elizabeth Ln
- 960 Beau Dr Unit 109
- 615 Cordial Dr
- 650 Murray Ln Unit 214
- 650 Murray Ln Unit 314
- 510 Florian Dr
- 930 Beau Dr Unit 312
- 640 Murray Ln Unit 111
- 721 Elmhurst Rd Unit G
- 701 S Elmhurst Rd Unit H
- 866 Clark Ln
- 231 Dover Dr
- 1582 Pennsylvania Ave Unit 3
- 115 Dover Dr Unit 13
- 105 King Ln
- 887 Ingram Place
- 147 Lance Dr
- 756 W Millers Rd
Your Personal Tour Guide
Ask me questions while you tour the home.