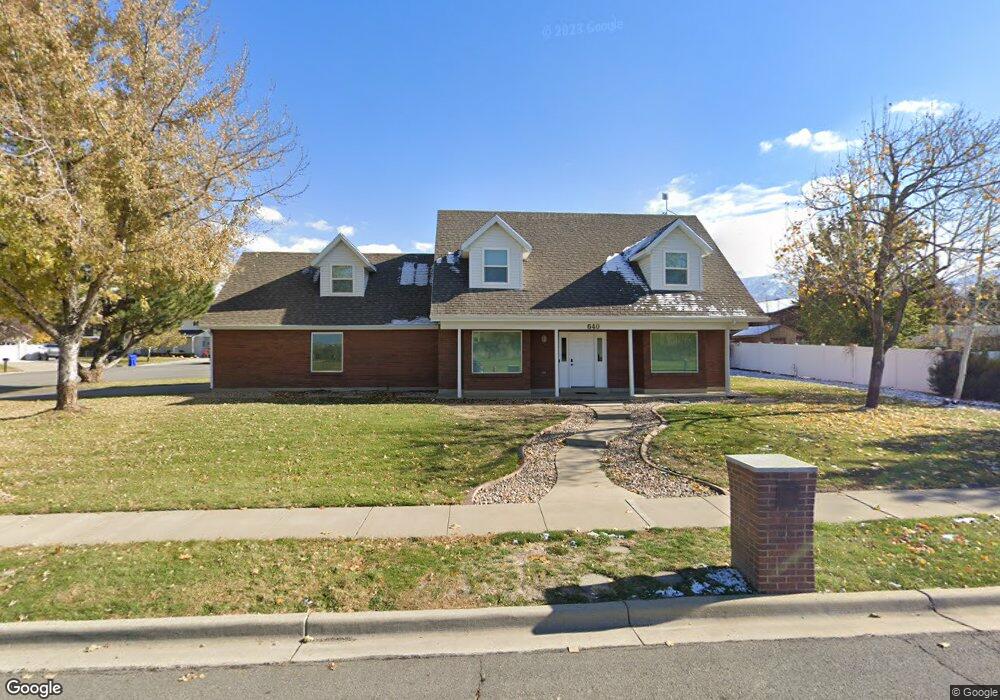
640 N 325 W Bountiful, UT 84010
Estimated Value: $527,000 - $742,000
4
Beds
3
Baths
2,750
Sq Ft
$216/Sq Ft
Est. Value
About This Home
This home is located at 640 N 325 W, Bountiful, UT 84010 and is currently estimated at $592,878, approximately $215 per square foot. 640 N 325 W is a home located in Davis County with nearby schools including Meadowbrook Elementary School, Bountiful Junior High School, and Viewmont High School.
Ownership History
Date
Name
Owned For
Owner Type
Purchase Details
Closed on
Feb 25, 2014
Sold by
Wynn Trent and Wynn Stacey
Bought by
Benson Gregory and Benson Barbara L
Current Estimated Value
Home Financials for this Owner
Home Financials are based on the most recent Mortgage that was taken out on this home.
Original Mortgage
$229,900
Outstanding Balance
$174,009
Interest Rate
4.38%
Mortgage Type
New Conventional
Estimated Equity
$418,869
Purchase Details
Closed on
Jan 30, 2003
Sold by
Westerdale Gary D and Westerdale Linda C
Bought by
Wynn Trent and Wynn Stacey
Home Financials for this Owner
Home Financials are based on the most recent Mortgage that was taken out on this home.
Original Mortgage
$171,000
Interest Rate
6.37%
Create a Home Valuation Report for This Property
The Home Valuation Report is an in-depth analysis detailing your home's value as well as a comparison with similar homes in the area
Purchase History
| Date | Buyer | Sale Price | Title Company |
|---|---|---|---|
| Benson Gregory | -- | None Available | |
| Wynn Trent | -- | Western States Title Company |
Source: Public Records
Mortgage History
| Date | Status | Borrower | Loan Amount |
|---|---|---|---|
| Open | Benson Gregory | $229,900 | |
| Previous Owner | Wynn Trent | $171,000 |
Source: Public Records
Tax History
| Year | Tax Paid | Tax Assessment Tax Assessment Total Assessment is a certain percentage of the fair market value that is determined by local assessors to be the total taxable value of land and additions on the property. | Land | Improvement |
|---|---|---|---|---|
| 2025 | $3,085 | $275,000 | $139,885 | $135,115 |
| 2024 | $3,037 | $282,150 | $129,518 | $152,632 |
| 2023 | $2,757 | $463,000 | $234,060 | $228,940 |
| 2022 | $2,927 | $270,600 | $126,688 | $143,912 |
| 2021 | $2,675 | $379,000 | $165,978 | $213,022 |
| 2020 | $2,369 | $336,000 | $140,155 | $195,845 |
| 2019 | $2,402 | $333,000 | $137,412 | $195,588 |
| 2018 | $2,213 | $301,000 | $134,464 | $166,536 |
| 2016 | $1,932 | $142,450 | $58,886 | $83,564 |
| 2015 | $1,870 | $129,910 | $58,886 | $71,024 |
| 2014 | $1,725 | $122,797 | $58,886 | $63,911 |
| 2013 | -- | $121,550 | $35,303 | $86,247 |
Source: Public Records
Map
Nearby Homes
- 563 N 200 W
- 499 N 200 W Unit 30
- 332 N 300 W
- 401 W 400 N Unit 49
- 790 N 500 W
- 399 W 400 N Unit 47
- 106 W 700 N
- 320 N 200 W Unit 4
- 184 Park Shadows Cir
- 93 W 700 N
- 290 N 500 W Unit 305
- 366 W 1000 N
- 1130 N 200 W
- 75 N Peregrine Ln W Unit 8
- 1260 N 200 W
- 252 N Main St
- 256 N Main St
- 254 N Main St
- 41 E 200 N Unit 6
- 51 E 200 N Unit 3
Your Personal Tour Guide
Ask me questions while you tour the home.