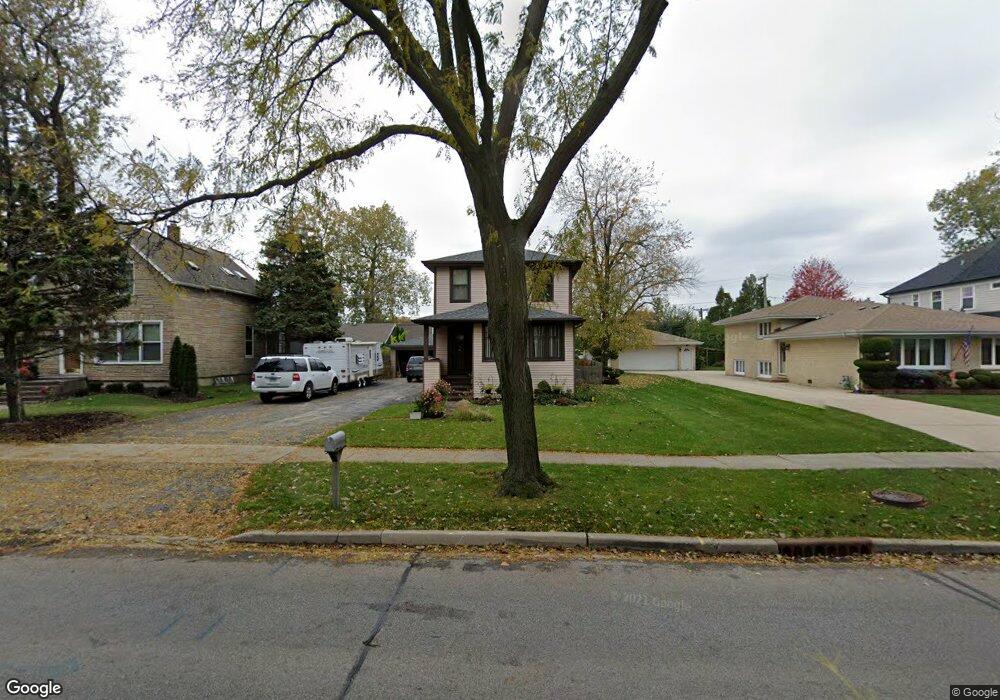
640 N West Ave Elmhurst, IL 60126
Estimated Value: $449,000 - $562,000
Studio
--
Bath
1,232
Sq Ft
$402/Sq Ft
Est. Value
About This Home
This home is located at 640 N West Ave, Elmhurst, IL 60126 and is currently estimated at $494,676, approximately $401 per square foot. 640 N West Ave is a home located in DuPage County with nearby schools including Emerson Elementary School, Churchville Middle School, and York Community High School.
Ownership History
Date
Name
Owned For
Owner Type
Purchase Details
Closed on
Sep 25, 2014
Sold by
Gehman Theodore M and Gehman Okcha
Bought by
Gehman Theodore M and Gehman Kimberly
Current Estimated Value
Home Financials for this Owner
Home Financials are based on the most recent Mortgage that was taken out on this home.
Original Mortgage
$268,550
Outstanding Balance
$205,655
Interest Rate
4.07%
Mortgage Type
VA
Estimated Equity
$289,021
Purchase Details
Closed on
Jul 14, 2000
Sold by
Larsen Matt R and Larsen Michelle A
Bought by
Gehman Theodore M and Gehman Okcha
Home Financials for this Owner
Home Financials are based on the most recent Mortgage that was taken out on this home.
Original Mortgage
$154,500
Interest Rate
8.19%
Mortgage Type
VA
Purchase Details
Closed on
Mar 28, 1995
Sold by
Holcomb Carolyn J
Bought by
Larsen Matt R and Larsen Michele A
Create a Home Valuation Report for This Property
The Home Valuation Report is an in-depth analysis detailing your home's value as well as a comparison with similar homes in the area
Home Values in the Area
Average Home Value in this Area
Purchase History
| Date | Buyer | Sale Price | Title Company |
|---|---|---|---|
| Gehman Theodore M | -- | Plymouth Title Guaranty Corp | |
| Gehman Theodore M | $150,000 | First American Title | |
| Larsen Matt R | -- | First American Title |
Source: Public Records
Mortgage History
| Date | Status | Borrower | Loan Amount |
|---|---|---|---|
| Open | Gehman Theodore M | $268,550 | |
| Closed | Gehman Theodore M | $154,500 |
Source: Public Records
Tax History
| Year | Tax Paid | Tax Assessment Tax Assessment Total Assessment is a certain percentage of the fair market value that is determined by local assessors to be the total taxable value of land and additions on the property. | Land | Improvement |
|---|---|---|---|---|
| 2024 | $8,330 | $144,014 | $75,080 | $68,934 |
| 2023 | $7,677 | $132,390 | $69,020 | $63,370 |
| 2022 | $7,664 | $131,120 | $65,410 | $65,710 |
| 2021 | $7,335 | $125,590 | $62,650 | $62,940 |
| 2020 | $6,900 | $120,300 | $60,010 | $60,290 |
| 2019 | $6,828 | $115,670 | $57,700 | $57,970 |
| 2018 | $6,485 | $109,540 | $54,960 | $54,580 |
| 2017 | $6,356 | $104,690 | $52,530 | $52,160 |
| 2016 | $6,085 | $96,660 | $48,500 | $48,160 |
| 2015 | $5,961 | $89,290 | $44,800 | $44,490 |
| 2014 | $5,733 | $79,640 | $36,960 | $42,680 |
| 2013 | $5,711 | $81,260 | $37,710 | $43,550 |
Source: Public Records
Map
Nearby Homes
- 568 N West Ave
- 528 West Ave
- 526 N West Ave
- 566 W Comstock Ave
- 594 W Comstock Ave
- 740 N Junior Terrace
- 655 W Comstock Ave
- 656 W Comstock Ave
- 468 N Highland Ave
- 902 E Krage Dr
- 432 N Ridgeland Ave
- 557 N Myrtle Ave
- 367 N Oak St
- 456 N Elm Ave
- 600 E Armitage Ave
- 17W645 Lorraine Ave
- 365 N Walnut St
- 322 N Highland Ave
- 266 W Fremont Ave
- 284 N Highland Ave
- 646 N West Ave
- 636 N West Ave
- 537 W Lorraine Ave
- 650 N West Ave
- 541 W Lorraine Ave
- 658 N West Ave
- 637 N West Ave
- 647 N West Ave
- 641 N West Ave
- 538 W Belden Ave
- 545 W Lorraine Ave
- 624 N West Ave
- 528 W Belden Ave
- 649 N West Ave
- 653 N West Ave
- 542 W Belden Ave
- 538 W Lorraine Ave
- 633 N West Ave
- 657 N West Ave
- 620 N West Ave
Your Personal Tour Guide
Ask me questions while you tour the home.