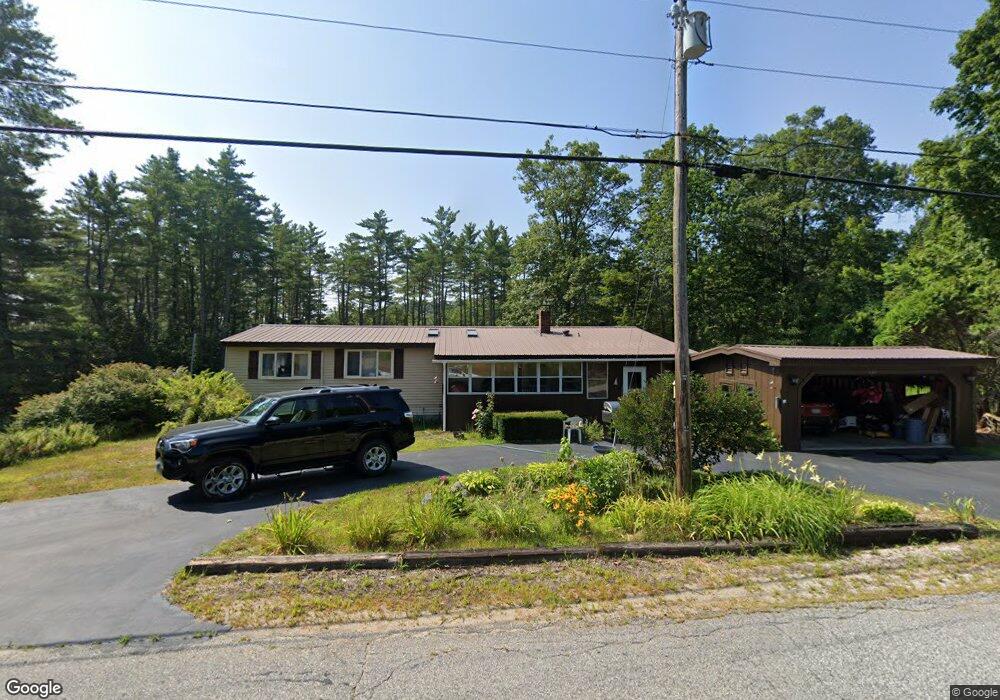
640 Pendexter Rd Parsonsfield, ME 04047
Estimated Value: $288,773 - $369,000
--
Bed
--
Bath
1,344
Sq Ft
$247/Sq Ft
Est. Value
About This Home
This home is located at 640 Pendexter Rd, Parsonsfield, ME 04047 and is currently estimated at $331,443, approximately $246 per square foot. 640 Pendexter Rd is a home.
Ownership History
Date
Name
Owned For
Owner Type
Purchase Details
Closed on
Apr 6, 2018
Sold by
Burnell Austin R
Bought by
Burnell Austin R and Costa-Burnell Ieda M
Current Estimated Value
Purchase Details
Closed on
Aug 4, 2014
Sold by
Burnell Kim L
Bought by
Burnell Austin R
Create a Home Valuation Report for This Property
The Home Valuation Report is an in-depth analysis detailing your home's value as well as a comparison with similar homes in the area
Home Values in the Area
Average Home Value in this Area
Purchase History
| Date | Buyer | Sale Price | Title Company |
|---|---|---|---|
| Burnell Austin R | -- | -- | |
| Burnell Austin R | -- | -- | |
| Burnell Kim L | -- | -- |
Source: Public Records
Tax History Compared to Growth
Tax History
| Year | Tax Paid | Tax Assessment Tax Assessment Total Assessment is a certain percentage of the fair market value that is determined by local assessors to be the total taxable value of land and additions on the property. | Land | Improvement |
|---|---|---|---|---|
| 2024 | $2,277 | $135,511 | $52,000 | $83,511 |
| 2023 | $2,195 | $135,511 | $52,000 | $83,511 |
| 2022 | $2,100 | $135,511 | $52,000 | $83,511 |
| 2021 | $2,094 | $135,511 | $52,000 | $83,511 |
| 2020 | $2,053 | $135,511 | $52,000 | $83,511 |
| 2019 | $2,019 | $135,511 | $52,000 | $83,511 |
| 2017 | $2,019 | $135,511 | $52,000 | $83,511 |
| 2016 | $2,019 | $135,511 | $52,000 | $83,511 |
| 2015 | $2,033 | $135,511 | $52,000 | $83,511 |
| 2013 | $1,978 | $135,511 | $52,000 | $83,511 |
Source: Public Records
Map
Nearby Homes
- 20 Hollyhock Farm Ln
- Lot #00 North Rd
- Lot# 01 North Rd
- Lot #02 North Rd
- R13/038 Weeks Rd
- 27 Nocturne Rd
- 178 Maplecrest Rd
- 424 Maplecrest Rd
- Lot #5 Jordan Heights Rd
- Lot 5 Fenderson Rd
- 266 S Hiram Rd
- 9 Penny Ln
- 32 Summer St
- 35 Pine St
- 42 Pine St
- 8 Pennie Ln
- Lot #8 Jordan Heights Rd
- Lot #2 Jordan Heights Rd
- Lot #3 Jordan Heights Rd
- Lot #4 Jordan Heights Rd
- 630 Pendexter Rd
- 627 Pendexter Rd
- 15 Brock Ln
- 17 Brock Ln
- 21 Lloyd Watson Rd
- 7 Clyde Ln
- 21 Brock Ln
- 661 Pendexter Rd
- 11 E Shore Dr
- Lot x Pendexter
- 0 Chick Rd Unit 750948
- 0 Chick Rd Unit 393279
- 0 Chick Rd Unit 214331
- 0 Chick Rd Unit 1068763
- 0 Chick Rd Unit 1149371
- 0 Chick Rd Unit 1149358
- 0 Chick Rd Unit 1208903
- 22 Chick Rd
- 77 E Shore Dr
- 72 Lloyd Watson Rd