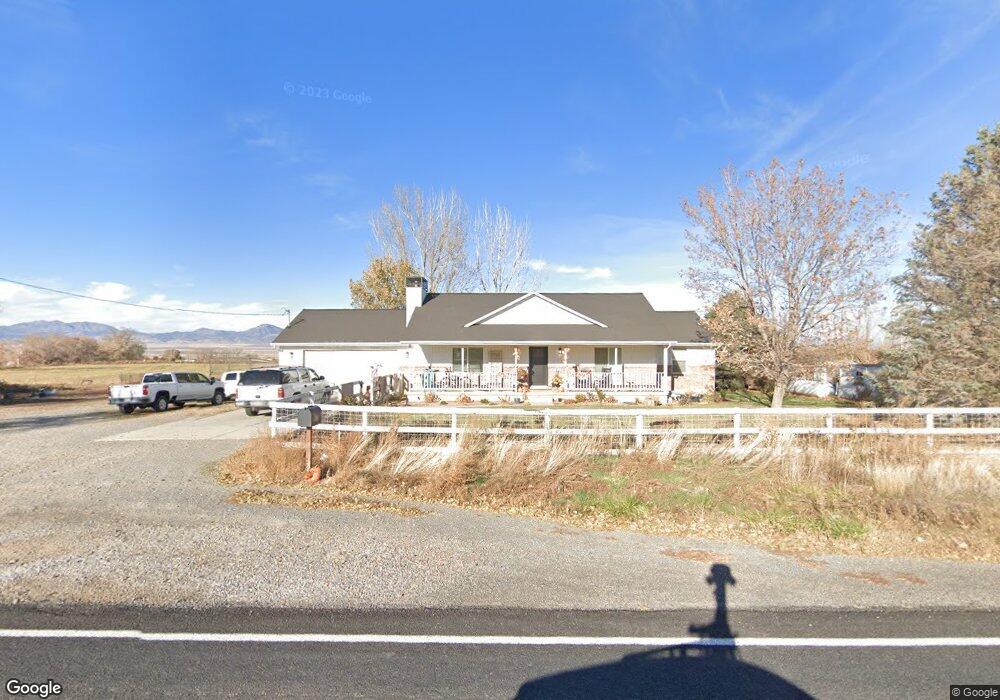
640 S State St Unit 1 Genola, UT 84655
Estimated Value: $767,000 - $1,372,000
3
Beds
3
Baths
1,618
Sq Ft
$605/Sq Ft
Est. Value
About This Home
This home is located at 640 S State St Unit 1, Genola, UT 84655 and is currently estimated at $979,698, approximately $605 per square foot. 640 S State St Unit 1 is a home located in Utah County with nearby schools including Goshen Elementary school, Payson Junior High School, and Payson High School.
Ownership History
Date
Name
Owned For
Owner Type
Purchase Details
Closed on
Jan 7, 2014
Sold by
Demille Heather
Bought by
Demille Alma D and Demille Heather L
Current Estimated Value
Purchase Details
Closed on
Jan 21, 2011
Sold by
Jackson Heather
Bought by
Demille Heather
Purchase Details
Closed on
Apr 24, 2006
Sold by
Kunz Jeffery D and Kunz Tana L
Bought by
Williams Brady Frank
Home Financials for this Owner
Home Financials are based on the most recent Mortgage that was taken out on this home.
Original Mortgage
$245,500
Interest Rate
6.3%
Mortgage Type
Fannie Mae Freddie Mac
Purchase Details
Closed on
Sep 1, 2004
Sold by
Sant Thomas B and Sant Laurie S
Bought by
Kunz Jeffery D and Kunz Tana L
Home Financials for this Owner
Home Financials are based on the most recent Mortgage that was taken out on this home.
Original Mortgage
$198,800
Interest Rate
5.92%
Mortgage Type
Purchase Money Mortgage
Create a Home Valuation Report for This Property
The Home Valuation Report is an in-depth analysis detailing your home's value as well as a comparison with similar homes in the area
Home Values in the Area
Average Home Value in this Area
Purchase History
| Date | Buyer | Sale Price | Title Company |
|---|---|---|---|
| Demille Alma D | -- | None Available | |
| Demille Heather | -- | None Available | |
| Williams Brady Frank | -- | Mountain West Title Company | |
| Kunz Jeffery D | -- | Empire Land Title Company |
Source: Public Records
Mortgage History
| Date | Status | Borrower | Loan Amount |
|---|---|---|---|
| Previous Owner | Williams Brady Frank | $245,500 | |
| Previous Owner | Kunz Jeffery D | $198,800 |
Source: Public Records
Tax History Compared to Growth
Tax History
| Year | Tax Paid | Tax Assessment Tax Assessment Total Assessment is a certain percentage of the fair market value that is determined by local assessors to be the total taxable value of land and additions on the property. | Land | Improvement |
|---|---|---|---|---|
| 2025 | $2,203 | $267,240 | $312,300 | $393,500 |
| 2024 | $2,251 | $227,896 | $0 | $0 |
| 2023 | $2,251 | $233,238 | $0 | $0 |
| 2022 | $2,053 | $609,300 | $317,200 | $292,100 |
| 2021 | $1,825 | $459,600 | $220,400 | $239,200 |
| 2020 | $1,587 | $406,200 | $174,000 | $232,200 |
| 2019 | $1,359 | $372,400 | $170,500 | $201,900 |
| 2018 | $1,246 | $331,100 | $155,500 | $175,600 |
| 2017 | $1,268 | $108,287 | $0 | $0 |
| 2016 | $1,115 | $95,721 | $0 | $0 |
| 2015 | $999 | $84,823 | $0 | $0 |
| 2014 | $884 | $75,408 | $0 | $0 |
Source: Public Records
Map
Nearby Homes
- 1010 S Anna Ekins Memorial Ln
- 975 E 715 S
- 692 Frost St Unit 84
- 688 Frost St Unit 85
- 686 W Frost St Unit 86
- 346 Red Rock Dr
- 402 Topaz Dr
- 583 Sunset Dr
- 633 Little Rock Dr
- 926 S Tanner Rd
- 956 N Main St
- 251 N Polly Ln
- 251 N Polly Ln Unit 4
- 255 Polly Ln Unit 6
- 245 N Polly Ln Unit 2
- 245 N Polly Ln
- 241 N Polly Ln Unit 1
- 263 Polly Ln Unit 8
- 689 Empress St Unit 78
- 685 Empress St Unit 79